
Trace an existing agent
You already have an agent running somewhere — LangChain, LangGraph, the OpenAI Agents SDK, a hand-rolled loop. This guide sends its runs into Console's Agent Observability without rewriting the agent, moving it behind the gateway, or changing which provider it calls.
Two lines of setup for most frameworks; an HTTP POST for everything else.
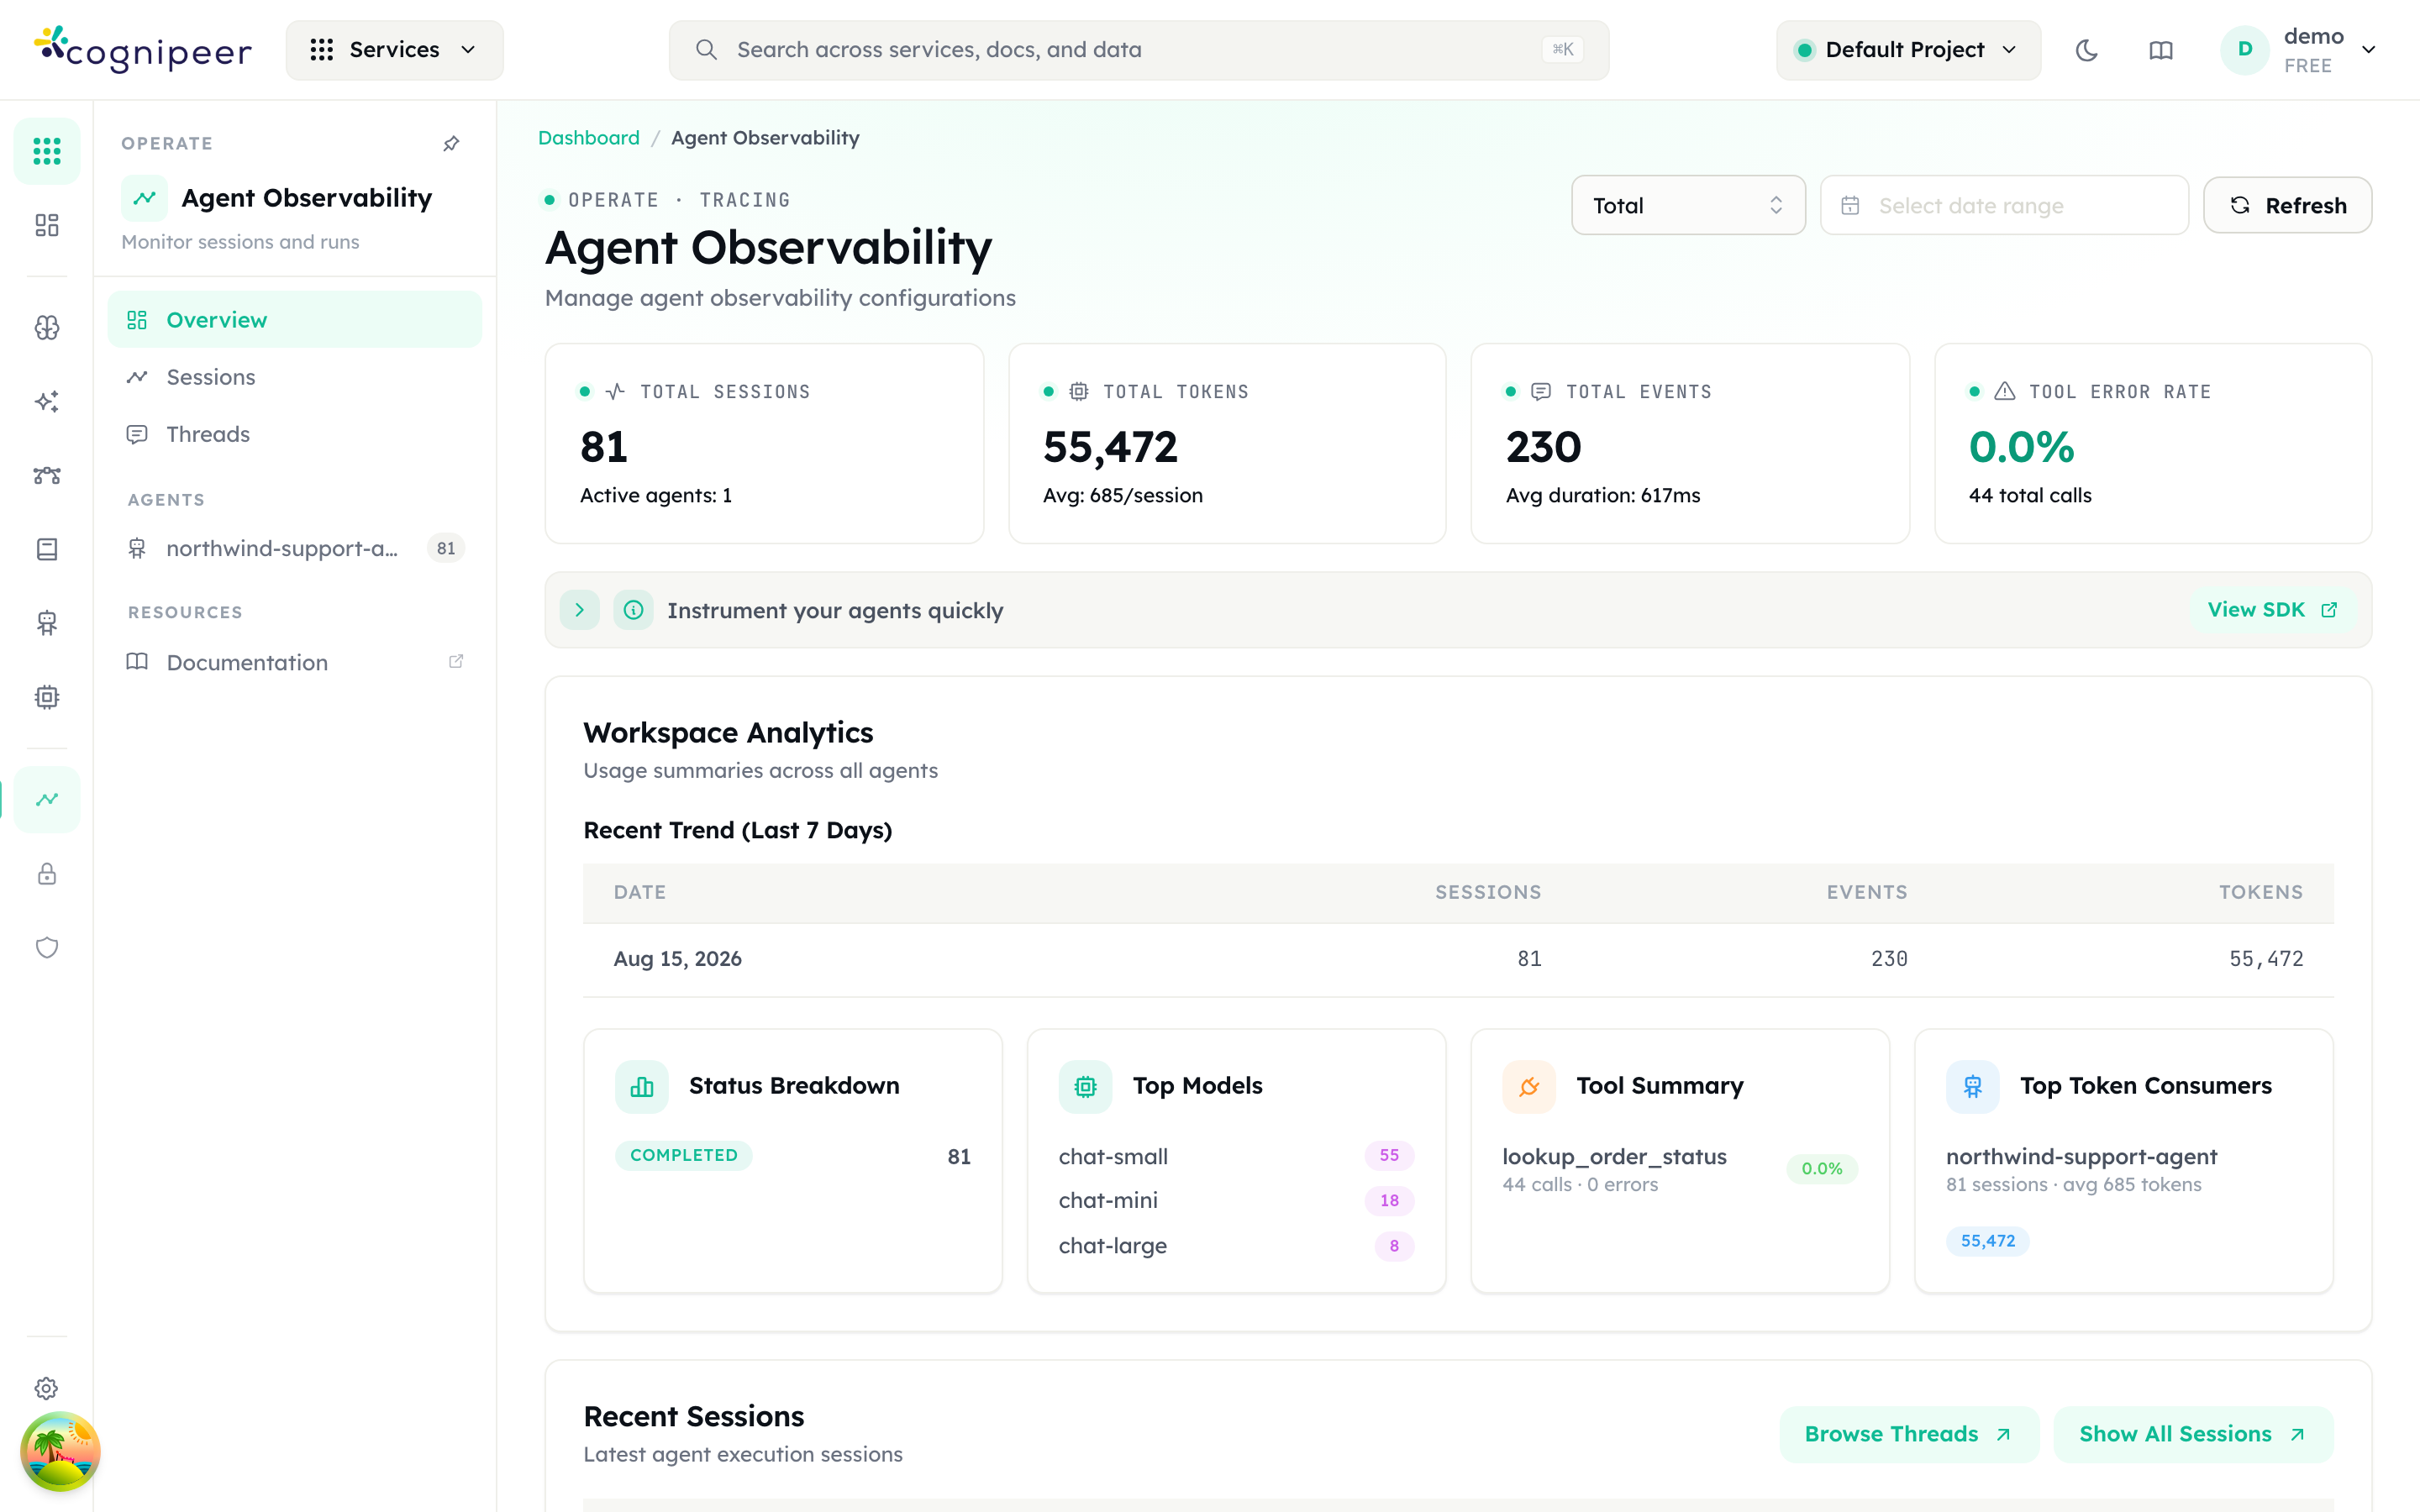
What you get
| Surface | Where | What it answers |
|---|---|---|
| Workspace rollup | /dashboard/tracing | Total Sessions, Total Tokens, Total Events, Tool Error Rate, top models, top token consumers |
| Session Explorer | /dashboard/tracing/sessions | Every run, filterable by agent, status and free text |
| Session timeline | /dashboard/tracing/sessions/<id> | Per-event prompts, completions, tool arguments, results, tokens and latency |
| Threads | /dashboard/tracing/threads | Runs grouped into one conversation by threadId |
| Per-agent overview | /dashboard/tracing/agents/<agentName> | One agent's volume, token split, versions, tool summary and 30-day trend |
| Deterministic insights | /dashboard/cost/analysis | Tool menu / call, AI calls / session, Input tokens / AI call, System prompt checks, Repeated tool calls, Recurring errors |
Traced traffic is also attributed as spend, so an agent that never touches the Console gateway still shows up under Cost & Optimization.
Everything on this page is community functionality. No enterprise licence is involved.
Before you start
- Pick the project first. Open the project switcher in the header (its menu is labelled Switch project) and select the project the traces belong to. An API token is permanently bound to the project that was active when it was created; you cannot move it later.
- Check the token owner's permissions. Tracing is the RBAC service
tracing, listed as Agent Observability. Ingest is a POST, so the token's owner needs write on it. See Multi-tenancy. - Have the Console host name. The client API base path is
/api/client/v1; the SDK wants the host root without that suffix.
Step 1 — Mint a token
- Open API Tokens (
/dashboard/tokens, page eyebrow Configure · API Tokens). - Select Create Token. The full-screen Create API Token form opens.
- Fill in Token Label — at least 3 characters, e.g.
support-bot tracing. - Select Create Token in the footer.
- The form switches to Your New API Token with an orange Important! alert: "This is the only time you'll see this token. Make sure to copy it now!" Copy the value under Your API Token:, then select I've Copied My Token.
The secret starts with cpeer_. Console stores only its hash and a short prefix — losing it means minting a new one.
Step 2 — Choose a route
| Route | Use it when |
|---|---|
A. cognipeer-observability SDK (recommended) | Your agent runs on Python or TypeScript and uses LangChain, LangGraph, the OpenAI Agents SDK, the Claude Agent SDK, the Vercel AI SDK or n8n (both TypeScript-only), or an OpenTelemetry-instrumented framework — or you are happy to decorate your own functions. |
B. POST /api/client/v1/tracing/sessions | Your agent runs in Go, Java, Rust, .NET, a shell script or anything else the SDK does not cover, or you want full control over what is recorded. |
Route A emits the canonical event shape for you. Route B makes you responsible for it — read Get the event types right before you write the payload.
Step 3 — Route A: point the SDK at Console
Set the environment your agent already reads:
export COGNIPEER_API_KEY="cpeer_…"
export COGNIPEER_BASE_URL="https://console.example.com"   # host root, no /api/client/v1
export COGNIPEER_AGENT_NAME="support-bot"
export COGNIPEER_AGENT_VERSION="1.4.0"
Install and initialise:
pip install "cognipeer-observability[langchain]"
# other extras: [langgraph] [openai-agents] [claude-agent-sdk] [otel] [all]npm install @cognipeer/observabilityimport cognipeer_observability as cognipeer
from cognipeer_observability.langchain import CognipeerCallbackHandler
cognipeer.init(agent={"name": "support-bot"})
agent.invoke(
{"messages": [("user", "where is my order?")]},
config={"callbacks": [CognipeerCallbackHandler(thread_id="conv-42")]},
)That is the whole integration. The framework-by-framework recipes, the TypeScript equivalents and the full option list live in the reference pages — this guide does not repeat them:
- Observability quickstart — every supported framework in one table
- LangChain integration — callback handler options, nested chains, streaming
Four things are worth knowing before you run this in production:
| Setting | Effect |
|---|---|
COGNIPEER_CAPTURE_CONTENT | all sends message bodies, metadata sends structure, tool names, tokens and latency only, none disables the transport. metadata also means Console cannot compute the System prompt insight, which needs the text. |
COGNIPEER_TRACING_MODE | auto (default), stream, or batch. auto buffers and switches to streaming as a run grows. |
COGNIPEER_TRACING_ENABLED | Kill switch. Set it off in local development rather than deleting the two lines. |
COGNIPEER_DEBUG | Prints what the SDK is sending. First thing to turn on when nothing appears. |
Short-lived processes — a Lambda, a cron job, a CLI — must call cognipeer.flush() before exiting, or the last export never leaves the process. The other Python entry points are cognipeer.init(), cognipeer.observe() and cognipeer.trace().
Step 4 — Read the traces in Console
Run your agent once, then open Agent Observability (/dashboard/tracing, eyebrow Operate · Tracing). The ingest write is asynchronous, so refresh if the run has only just finished.
Select Show All Sessions to reach the Session Explorer.
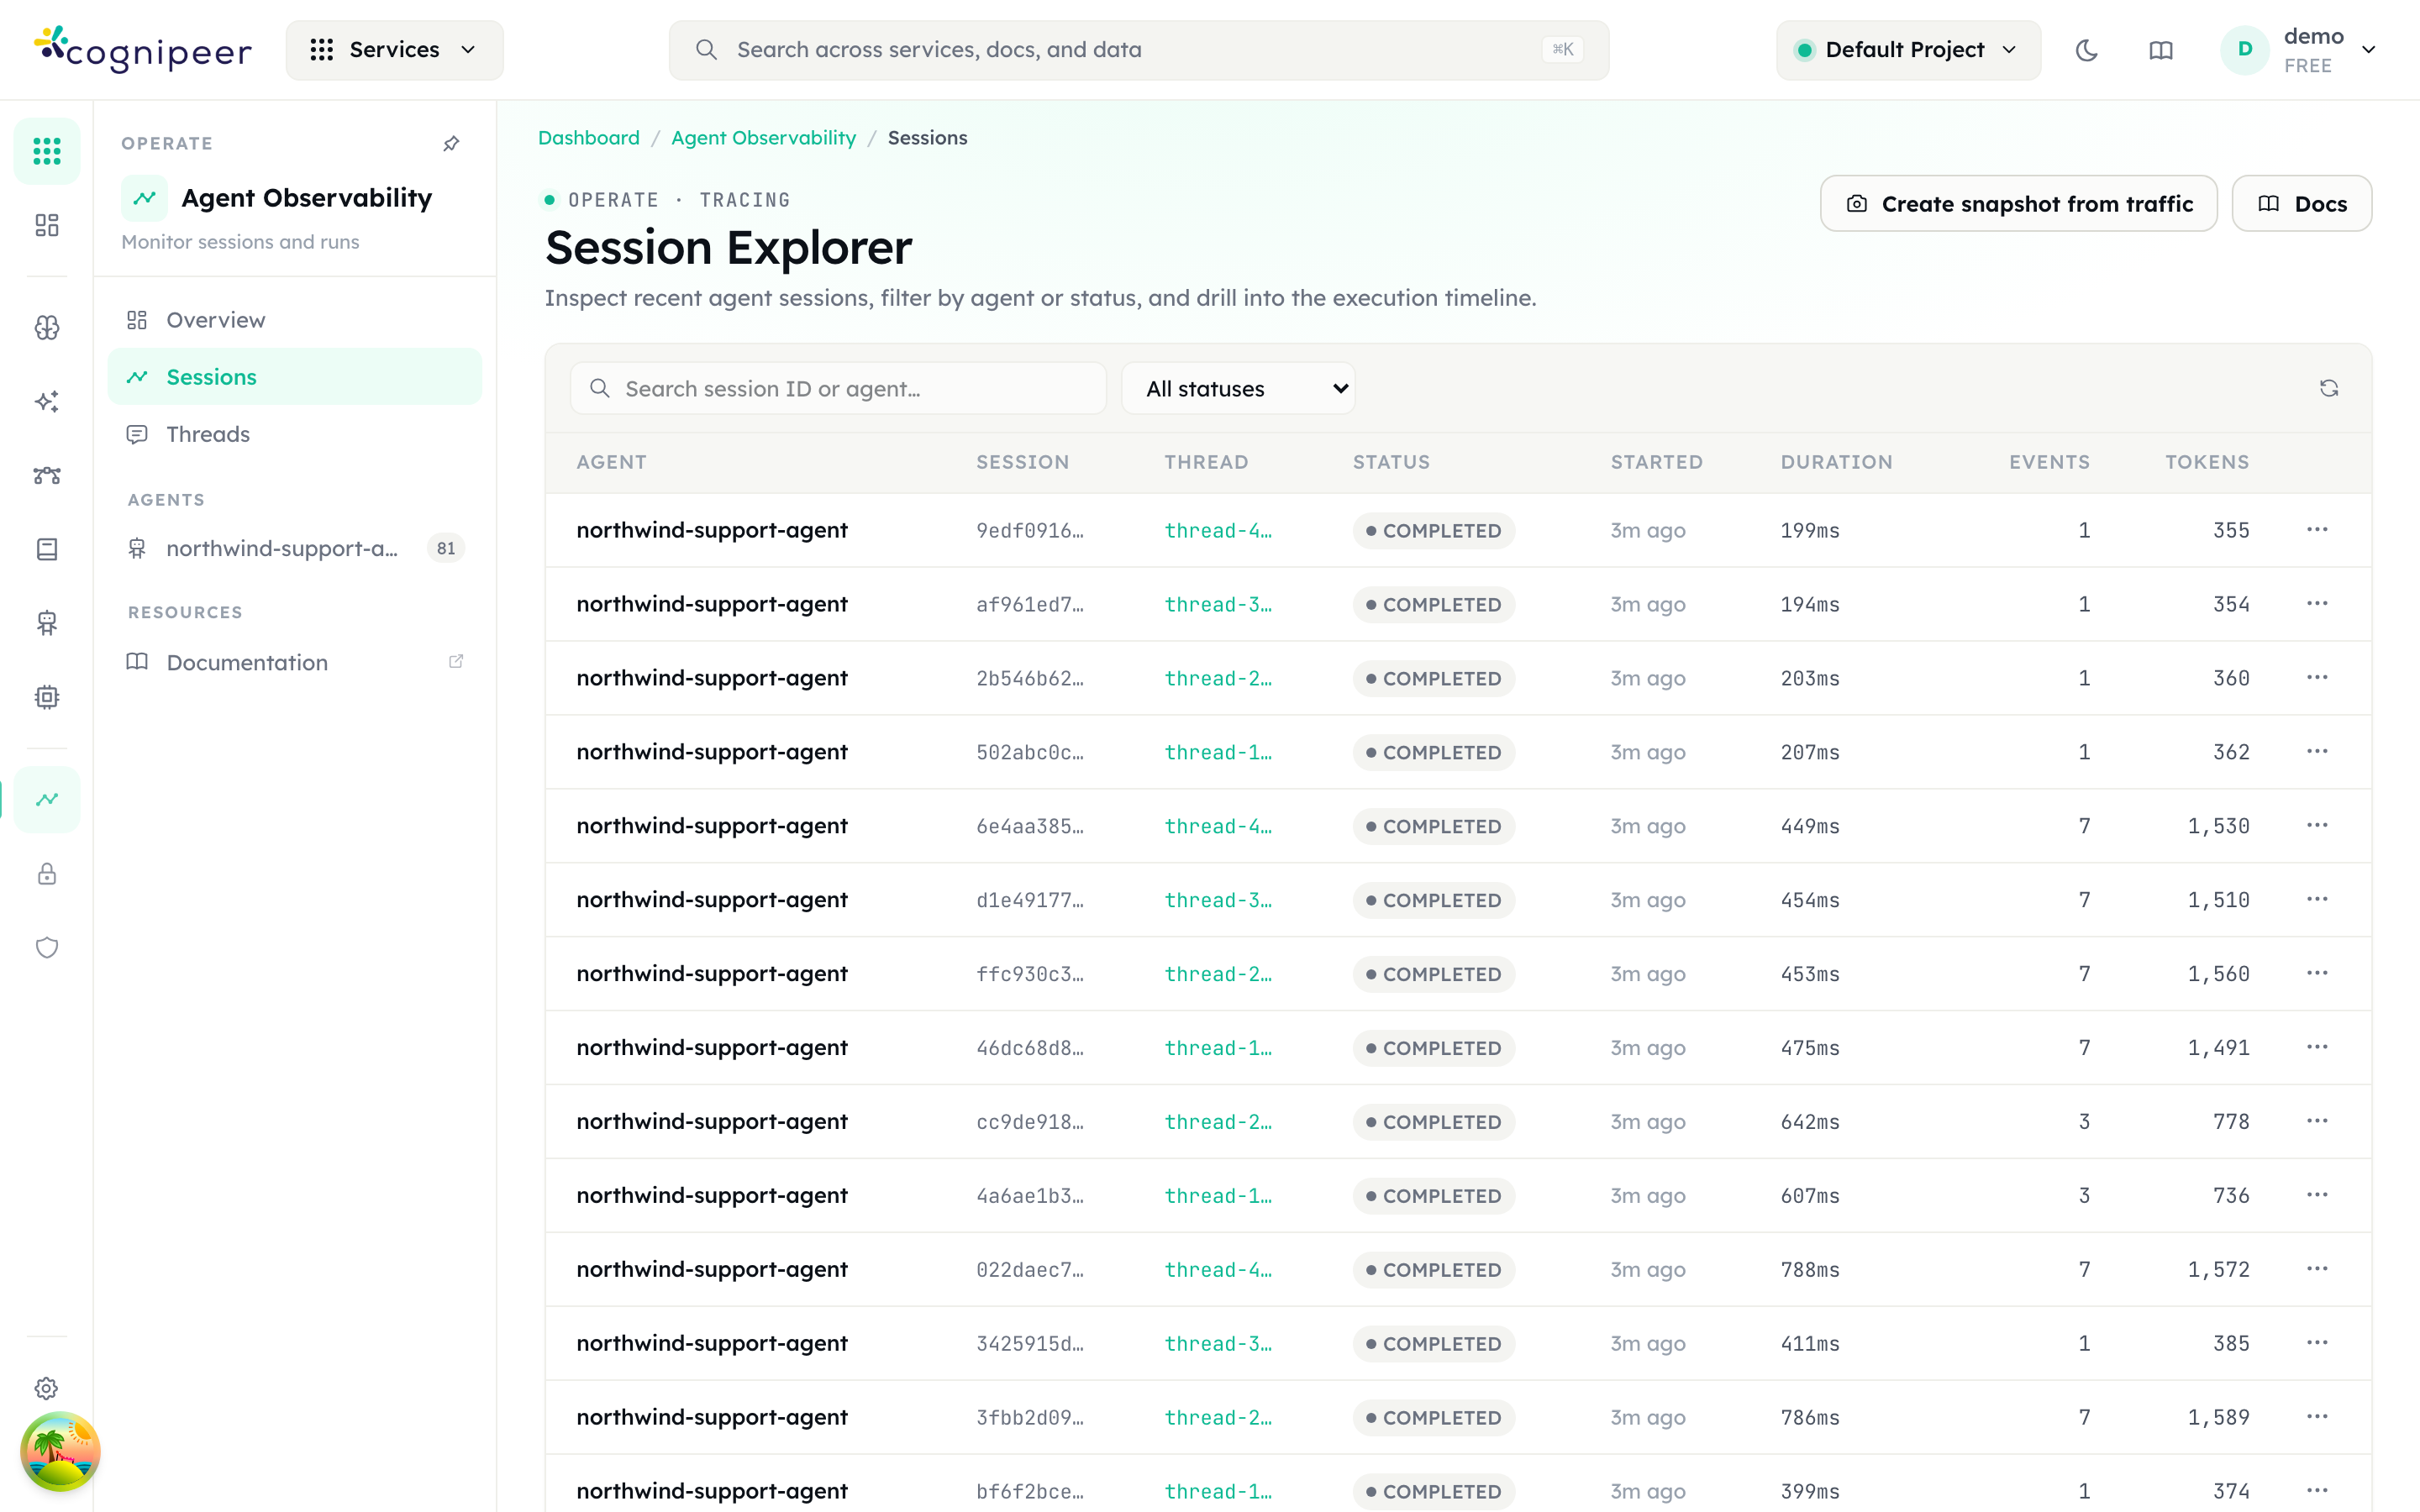
Columns are Agent, Session, Thread, Status, Started, Duration, Events and Tokens. The status filter offers All statuses, Success, Error and In progress; the search box matches session id, thread id or agent name.
Click a row to open its timeline.
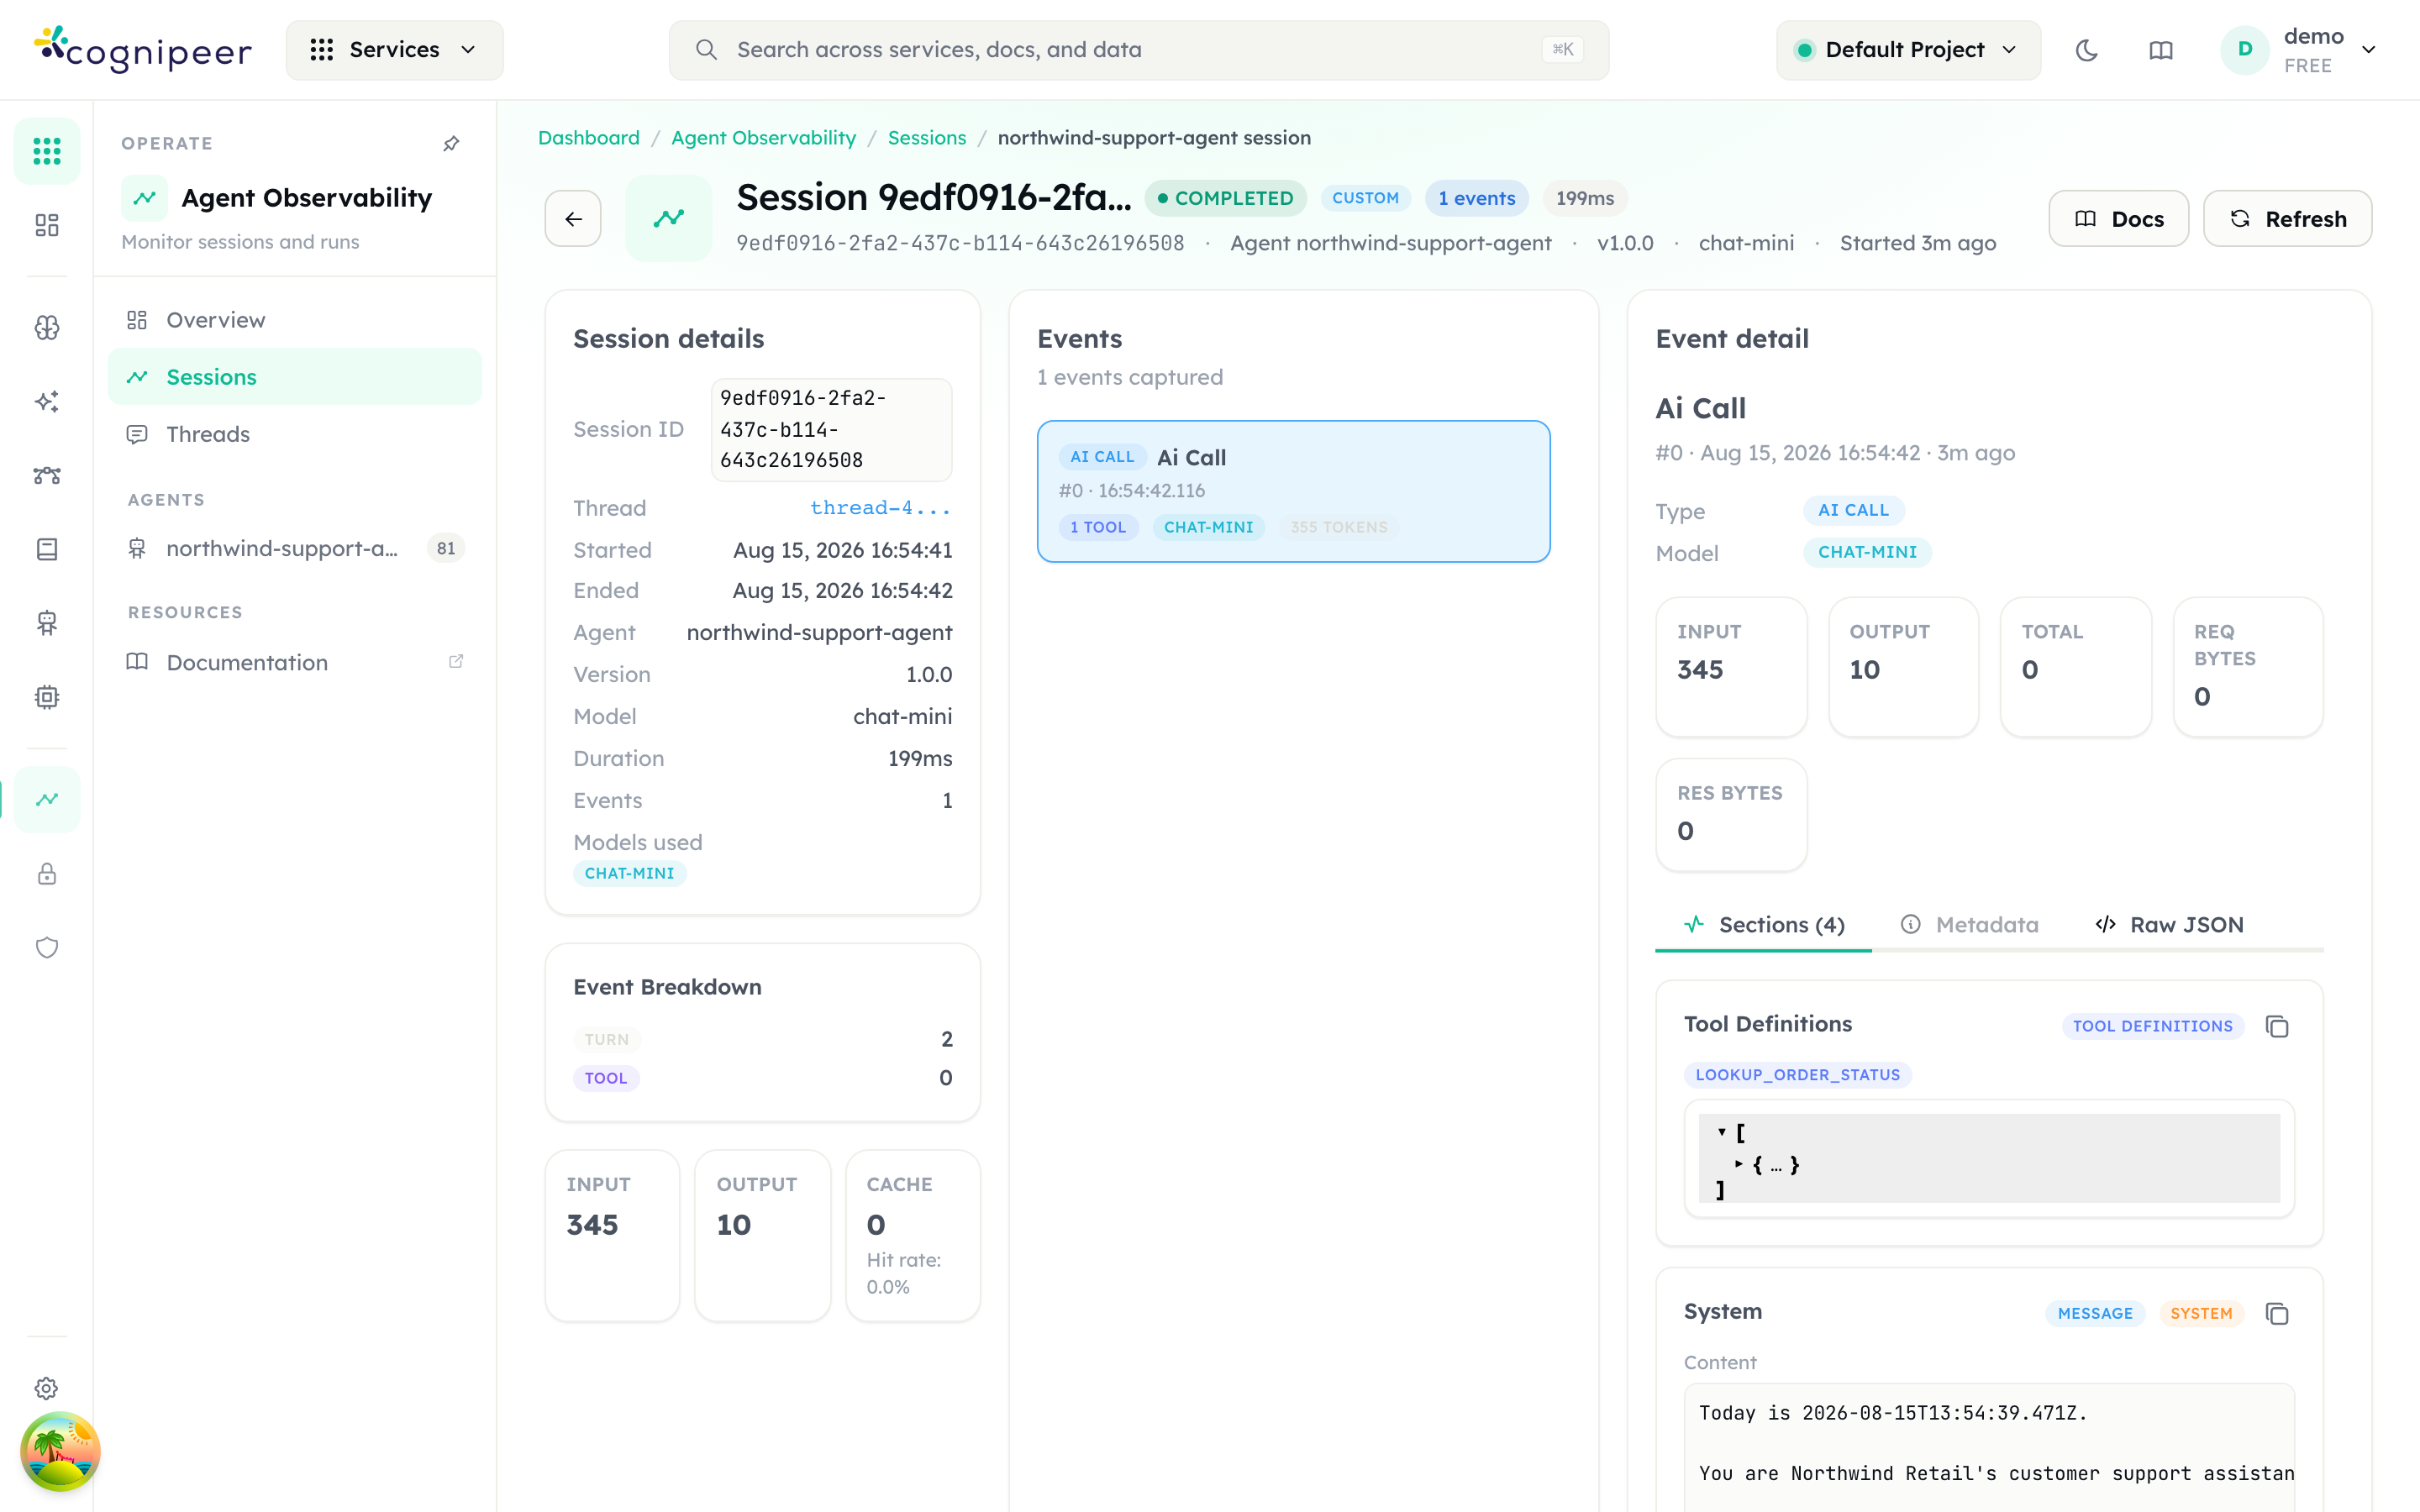
- The middle column lists the events in sequence. When your events carry
spanId/parentSpanId, the icon in that column's header toggles between list and tree view. - An indigo N tools badge on a model-call row is the tool menu that call was charged for. Hover it for the names.
- The right-hand panel has Sections, Metadata and Raw JSON tabs. A
tool_definitionssection renders as a name list plus the collapsible JSON schemas.
For one agent's rollup, use the Agents section in the left sub-nav — it lists the recently active agent names, up to 20, each with its session count.

Deterministic analysis is not on this page. System-prompt checks, tool-menu stats, repeated-call waste and recurring errors live under Cost & Optimization → Analysis (/dashboard/cost/analysis), and the page links across to it.
Route B — Post sessions yourself
The batch endpoint takes a finished run in one request.
POST /api/client/v1/tracing/sessions
Authorization: Bearer cpeer_…
Content-Type: application/jsoncurl -X POST https://console.example.com/api/client/v1/tracing/sessions \
-H "Authorization: Bearer $COGNIPEER_API_KEY" \
-H "Content-Type: application/json" \
-d @session.jsonA 200 returns { "success": true, "sessionId": …, "eventsStored": N }.
Session fields
| Field | Required | Notes |
|---|---|---|
sessionId | yes | 400 without it. Re-posting the same id replaces the session and all of its events. |
agent.name | no, but send it | Names the agent everywhere in the UI and in the sub-nav. |
agent.version, agent.model | no | Version is what makes a before/after comparison possible. |
threadId | no | Groups sessions under Threads. Use a chat id, ticket number or user session. |
traceId, rootSpanId | no | Stored verbatim, for correlation with your existing tracing stack. |
status | no | Stored as unknown when omitted. Use success / error / in_progress to match the Session Explorer filter. |
startedAt, endedAt | no | ISO-8601 strings. startedAt falls back to the ingest time. |
durationMs | no | Stored as sent. This endpoint does not derive it from startedAt/endedAt, so the Session Explorer's Duration column stays empty without it. |
summary | no, but send it | Session totals are read from here — totalInputTokens, totalOutputTokens, totalCachedInputTokens, totalBytesIn, totalBytesOut. They are not derived from the events on this endpoint. |
errors | no | Array of strings or objects; a bare string becomes { message }. |
events | yes in practice | The timeline. |
Event fields
| Field | Notes |
|---|---|
type | ai_call or tool_call. See the next section — this is the field that decides whether the insights work. |
label | The row title in the timeline. |
sequence | Ordering within the session. |
timestamp | Defaults to the ingest time. |
model | On ai_call. Feeds Models used, the Top Models card and cost attribution. |
inputTokens, outputTokens, cachedInputTokens | Also read from a usage object in either camelCase or snake_case (input_tokens, cache_read_input_tokens, …). |
toolName | On tool_call. Drives Tools used and the Tool Summary, and decides which tools appear in the tool error rate. |
toolDefinitions | The tool menu offered to the model on this call. Normalised into a tool_definitions section for you. |
sections | The renderable payload — see below. |
status, error | Recorded on the event; a bare string error is stored as { message }. The session's Errors card and Recurring errors read the session-level errors array instead, so send both. |
spanId, parentSpanId | Enable the tree view. |
durationMs | On the streaming endpoints it accumulates into summary.totalDurationMs. |
requestBytes, responseBytes | Kept on the event. They do not roll up into the session totals. |
actor | { name, role, scope }. scope: "tool" with a name is an accepted fallback when toolName is absent. |
Streaming a long run
For runs that outlive a single request, or payloads that would breach the body cap, use the three streaming endpoints instead:
| Endpoint | Behaviour |
|---|---|
POST /api/client/v1/tracing/sessions/stream/:sessionId/start | Creates the session, or reopens an existing one without resetting its totals. |
POST /api/client/v1/tracing/sessions/stream/:sessionId/events | Appends one event, wrapped as { "event": { … } }. Returns 404 if /start never ran for that id. |
POST /api/client/v1/tracing/sessions/stream/:sessionId/end | Closes the run. Totals merge monotonically, so a retried end is idempotent. |
Unlike the batch endpoint, streaming accumulates session totals from each event as it arrives — you do not need to compute a summary.
OpenTelemetry producers have a fourth option: POST /api/client/v1/traces accepts an OTLP/HTTP JSON ExportTraceServiceRequest and derives sessions and events from the spans. See OpenTelemetry.
The complete wire reference, including the read endpoints, is on the Tracing API page; the data model is in Agent Tracing.
Get the event types right
This is the part that goes wrong.
Console's deterministic insights key off canonical event types. An event whose type is something else — llm, generation, chain, step — still renders in the timeline, with its own badge and its own sections. It simply does not count. Tool menu / call, AI calls / session, Input tokens / AI call, System prompt and Repeated tool calls all come back empty, and nothing in the UI tells you why.
The contract:
- A model call is
type: "ai_call", carryingmodel,inputTokens,outputTokensand its sections. - A tool call is
type: "tool_call", carryingtoolName. - Sections are objects with a
kind:message,tool_call,tool_result(tool_responseis treated the same) ortool_definitions. Any other kind still renders, untyped. - A
messagesection needs aroleand a stringcontent— not an array of content parts. - A
tool_definitionssection needs atoolsarray of{ name, description?, parameters? }.
What each surface actually reads:
| Console surface | Reads |
|---|---|
| AI calls / session, Input tokens / AI call | Events with type: "ai_call" and their inputTokens |
| Tool calls / session | Events with type: "tool_call" |
| Tools used, Tool Summary | Every distinct toolName collected from the session's events |
| Tool Error Rate | Those same tool names, counted as errored when the session's status is error — not the event's own status |
| Tool menu / call, the N tools badge | tool_definitions sections on ai_call events |
| System prompt and System prompt checks | The longest { "kind": "message", "role": "system" } section found on an ai_call (role match is case-insensitive) |
| Repeated tool calls | tool_call events carrying both toolName and arguments — from a tool_call section's arguments, args, input or content, or from metadata.arguments |
A minimal, correct session:
{
  "sessionId": "sess-2026-08-15-0001",
  "threadId": "conv-42",
  "agent": { "name": "support-bot", "version": "1.4.0", "model": "gpt-4o-mini" },
  "status": "success",
  "startedAt": "2026-08-15T09:00:00.000Z",
  "endedAt": "2026-08-15T09:00:04.120Z",
  "summary": { "totalInputTokens": 2310, "totalOutputTokens": 180 },
  "events": [
    {
      "type": "ai_call",
      "label": "Plan the answer",
      "sequence": 1,
      "model": "gpt-4o-mini",
      "inputTokens": 2100,
      "outputTokens": 60,
      "toolDefinitions": [
        {
          "name": "search_orders",
          "description": "Look up an order by id",
          "parameters": {
            "type": "object",
            "properties": { "orderId": { "type": "string" } }
          }
        }
      ],
      "sections": [
        { "kind": "message", "role": "system", "content": "You are a support agent." },
        { "kind": "message", "role": "user", "content": "where is my order 1234?" }
      ]
    },
    {
      "type": "tool_call",
      "label": "search_orders",
      "sequence": 2,
      "toolName": "search_orders",
      "sections": [
        { "kind": "tool_call", "content": "{\"orderId\":\"1234\"}" },
        { "kind": "tool_result", "content": "{\"status\":\"shipped\"}" }
      ]
    },
    {
      "type": "ai_call",
      "label": "Answer",
      "sequence": 3,
      "model": "gpt-4o-mini",
      "inputTokens": 210,
      "outputTokens": 120,
      "sections": [
        { "kind": "message", "role": "assistant", "content": "It shipped yesterday." }
      ]
    }
  ]
}
Post that, open Analysis, pick the agent, and the insight cards fill: a 1-tool menu on 2 AI calls, an extractable system prompt, and no repeated calls.
Tool definitions are capped per section: 128 tools, 64 KB serialised, names at 200 characters, descriptions at 4 000. Beyond the size budget, entries keep their name and description, lose parameters, and are marked truncated: true. Malformed entries are dropped silently rather than failing the request.
Gotchas
| Symptom | Cause |
|---|---|
| Re-posting a session lost its earlier events | The batch endpoint deletes and recreates the whole event list for that sessionId. Always send the complete run, or use the streaming endpoints. |
| Session shows 0 tokens but per-call insights look right | The batch endpoint reads session totals from summary, not from the events. Send summary.totalInputTokens / totalOutputTokens. |
200 OK, nothing in the list yet | Ingest writes are fire-and-forget. The response confirms acceptance, not persistence; give it a moment and refresh. |
413 Payload too large | The body cap is TRACING_MAX_BODY_SIZE_MB, default 10 MB. Split the run across the streaming endpoints. |
429 agents limit reached (n/m) | Every distinct agent.name counts against the agent quota. Do not put a run id, timestamp or user id in the agent name — version it with agent.version instead. |
Other 429s | Per-request event limits, the tracing rate limit, and the session-count quota all return 429 with a reason. |
404 Session not found on /events | /start was never called for that sessionId. |
401 with a token you know is valid | The header check is case-sensitive: Authorization: Bearer …, not bearer. |
| Deleted token still works | Auth results are cached for 60 seconds. |
| Insights look stale or thin | Deterministic insights sample the 12 most recent sessions in the window, and Recurring errors shows the top 6 messages. They are a probe, not an audit. |
| System prompt reads "not found" | Either no ai_call carried a {kind:'message', role:'system'} section with string content, or the SDK is running with COGNIPEER_CAPTURE_CONTENT=metadata. |
| Tool menu / call reads "not traced" | No ai_call in the sample carried a tool_definitions section. |
| Prompt Cache Hit Rate tile is missing | The tile only appears once a session reports cached input tokens. |
A script cannot read /api/tracing/... | Those are dashboard routes and need a browser session. Bearer tokens work against /api/client/v1/... only, where the read surface is tracing/threads and tracing/threads/:threadId. |
Next
- Cut what the traces expose: Cost & Optimization → Analysis turns the numbers above into a work list.
- Turn real traffic into a regression suite with the traffic snapshot wizard (
/dashboard/evaluations/snapshots/new, source Agent traces) — see Evaluation and analysis. - Let an agent query its own history through the built-in Console MCP server, documented in Agent Tracing.