
Agent Tracing
The tracing system records and visualizes AI agent execution sessions, including LLM calls, tool use, retrieval operations, and multi-agent workflows. The console exposes this under Operate → Agent Observability.
Operator view
The overview screen consolidates every signal you need to triage a run: total sessions and tokens for the current window, the rolling event count, tool error rate, plus per-agent breakdowns, top models, and top token consumers. Recent traffic is summarised by day so anomalies in the last week stand out.
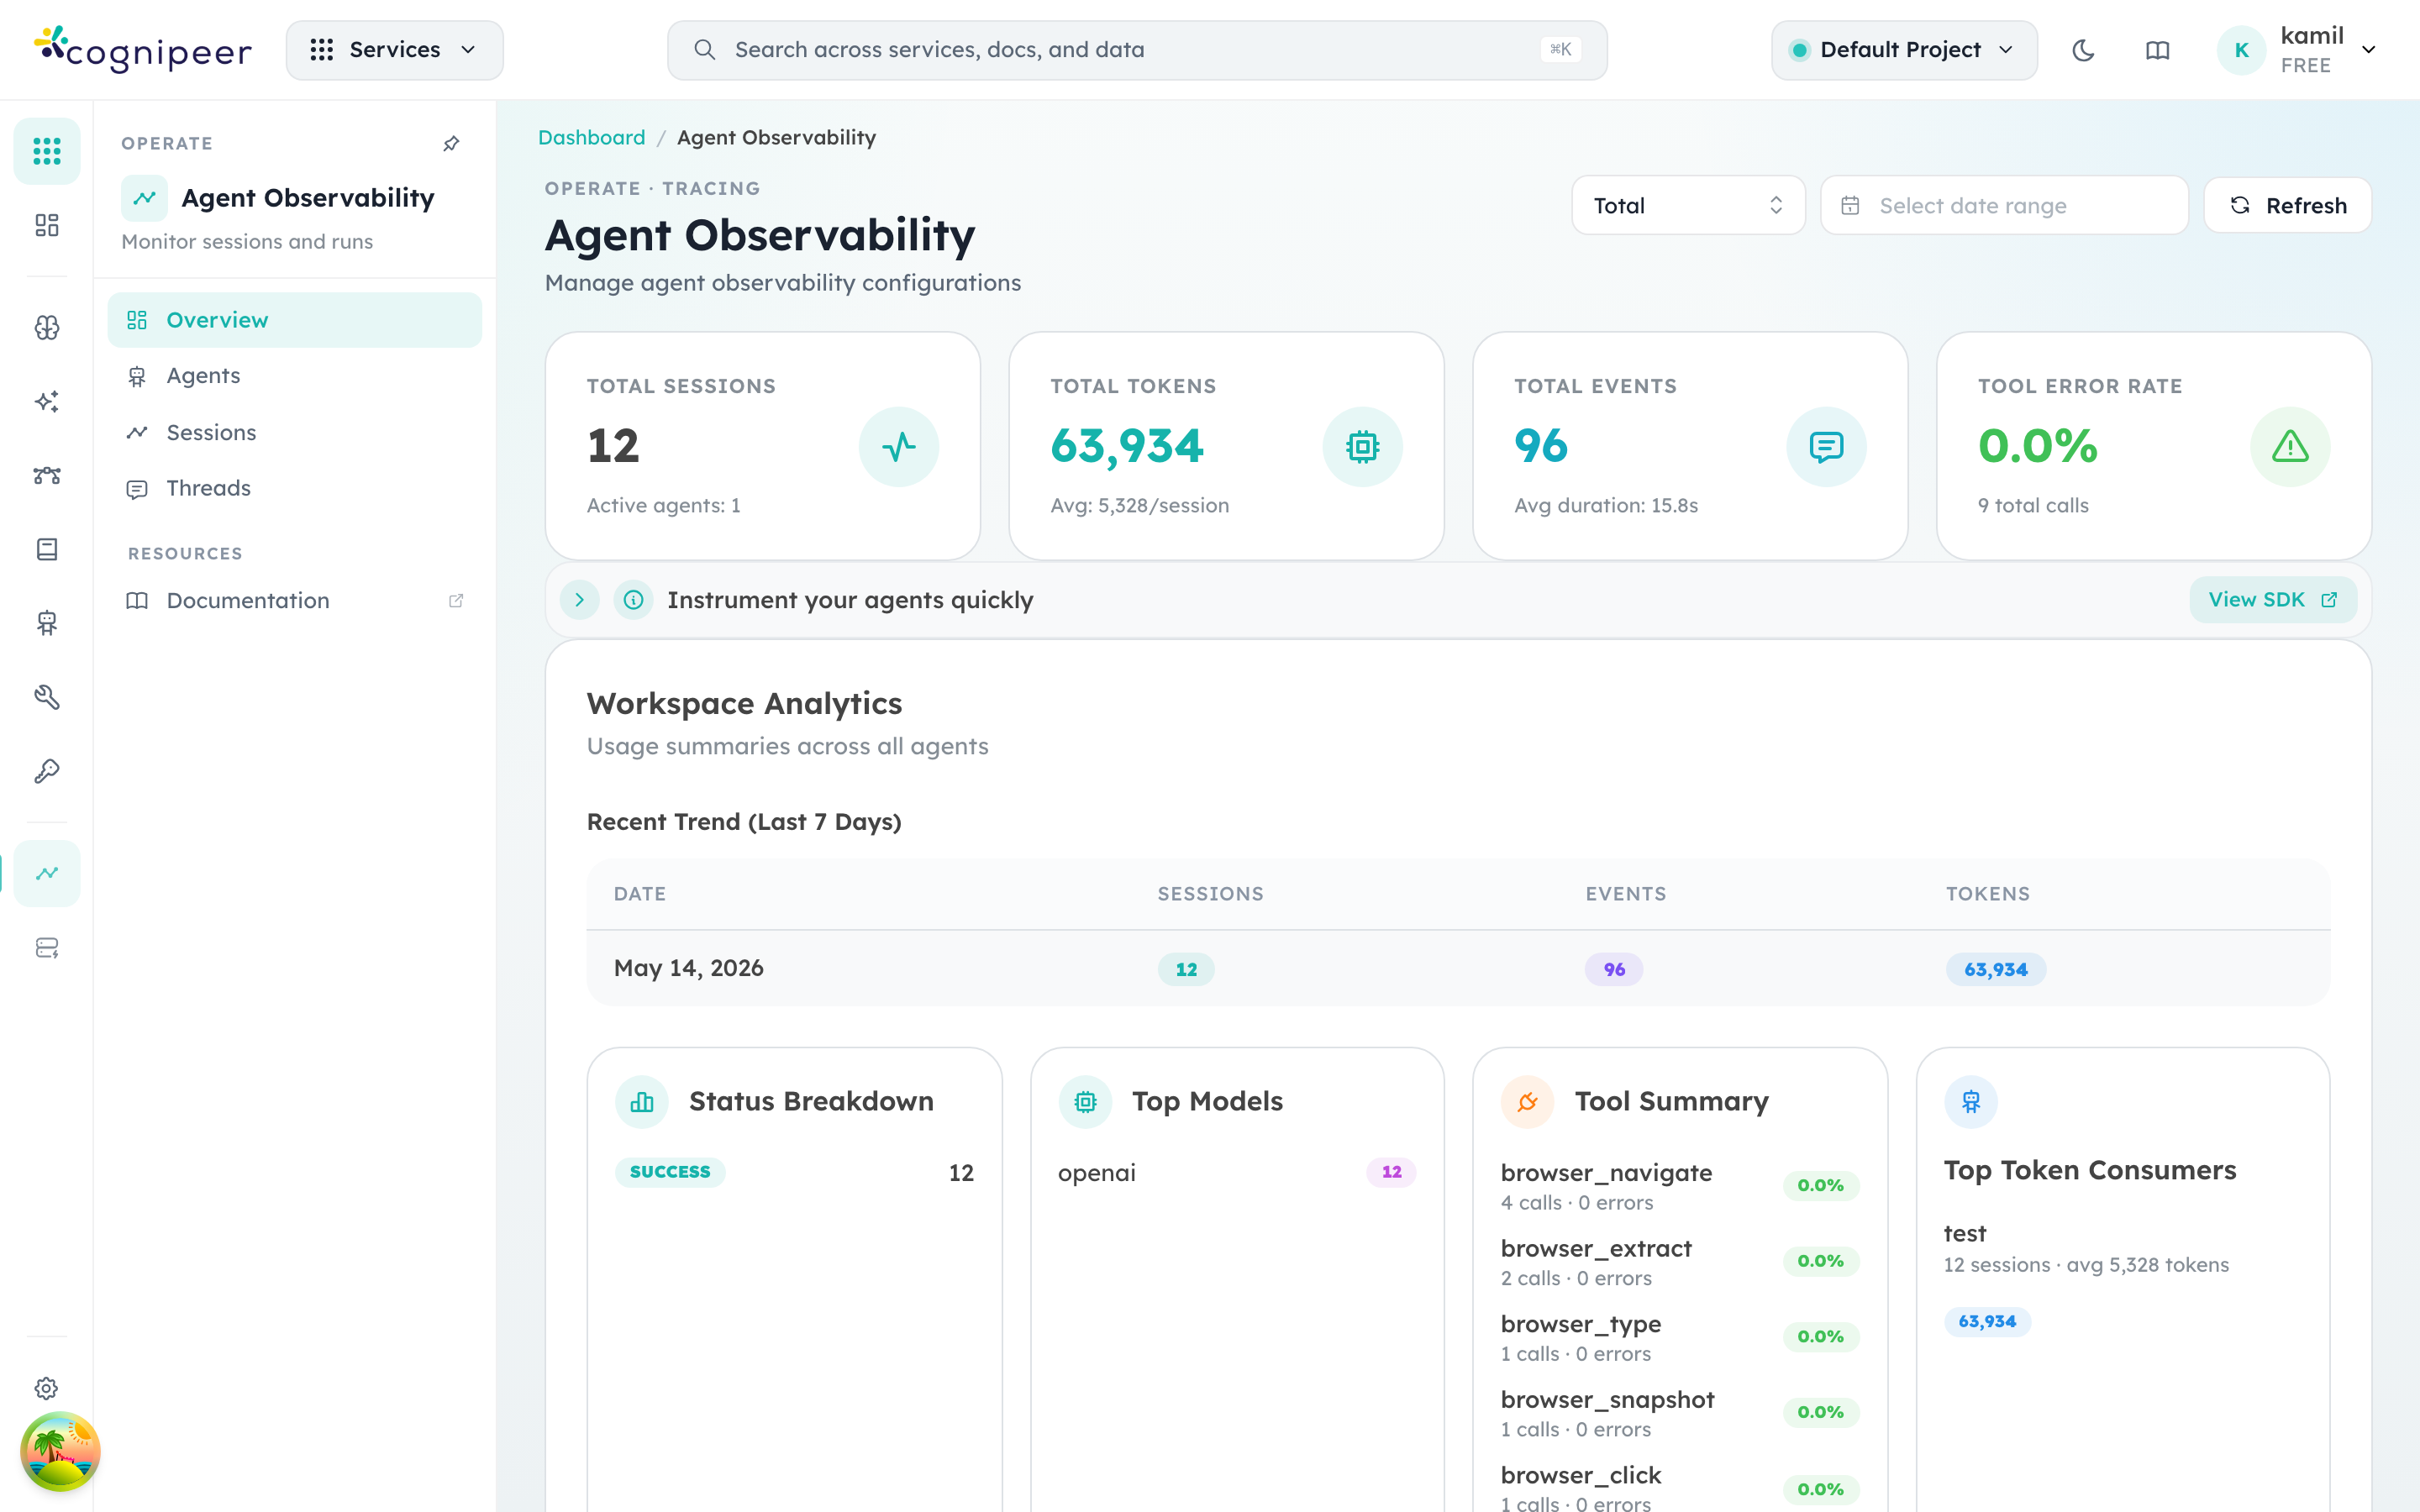
The left sidebar splits the surface into three operational views:
- Overview — the workspace-wide rollup pictured above.
- Sessions — the flat session log, filterable by date, agent, status, or thread.
- Threads — multi-turn conversations grouped by
threadId; useful when reconstructing a user's full interaction.
Clicking a session opens its event timeline — LLM calls, tool calls, retrieval steps, and child-agent invocations are rendered as nested spans with token usage and latency on each row.
Concepts
| Concept | Description |
|---|---|
| Session | A single agent execution (one conversation turn or task) |
| Thread | A group of related sessions linked by threadId |
| Event | An individual step within a session (LLM call, tool use, etc.) |
| Agent | The named agent that executed the session |
Data Model
Session Record
interface IAgentTracingSession {
  sessionId: string;       // Unique session identifier
  threadId?: string;       // Cross-session correlation
  traceId?: string;        // W3C trace identifier
  rootSpanId?: string;     // Root span for the session
  source?: 'custom' | 'otlp';
  agentName: string;       // Agent identifier
  agentLabel?: string;     // Human-friendly label
  summary?: string;        // Session summary
  status: string;          // completed, failed, etc.
  durationMs: number;
  totalInputTokens: number;
  totalOutputTokens: number;
  totalTokens: number;
  eventCounts: Record<string, number>;
}
Event Record
interface IAgentTracingEvent {
  type: string;           // llm_call, tool_call, retrieval, etc.
  label?: string;         // Step description
  sequence: number;       // Ordering within session
  traceId?: string;       // Correlates to session trace
  spanId?: string;        // Unique span for this event
  parentSpanId?: string;  // Parent span (hierarchy)
  actor?: string;         // Agent/tool name
  sections: EventSection[];
  inputTokens?: number;
  outputTokens?: number;
}
Ingestion Methods
Batch Mode
Send a complete session with all events in one request:
POST /api/client/v1/tracing/sessions
Authorization: Bearer <token>{
"sessionId": "sess-123",
"threadId": "thread-456",
"traceId": "4bf92f3577b34da6a3ce929d0e0e4736",
"rootSpanId": "00f067aa0ba902b7",
"agent": { "name": "research-agent", "version": "1.0.0", "model": "gpt-4" },
"status": "completed",
"durationMs": 3500,
"events": [
{
"type": "llm_call",
"label": "Generate response",
"sequence": 1,
"sections": [
{ "type": "input", "content": "..." },
{ "type": "output", "content": "..." }
]
}
]
}Streaming Mode
For long-running sessions, stream events as they happen:
POST /api/client/v1/tracing/sessions/stream/:sessionId/start
POST /api/client/v1/tracing/sessions/stream/:sessionId/events
POST /api/client/v1/tracing/sessions/stream/:sessionId/end
Start a session:
{
  "agentName": "research-agent",
  "threadId": "thread-456"
}
OTLP Mode
For OpenTelemetry-native producers (OTLP/HTTP JSON):
POST /api/client/v1/tracesThis endpoint accepts ExportTraceServiceRequest payloads and maps spans into sessions/events automatically.
Correlation Fields
Use these fields to connect traces across tools and dashboards:
| Field | Scope | Description |
|---|---|---|
traceId | Session + Event | End-to-end trace correlation ID |
rootSpanId | Session | Root span for the full session |
spanId | Event | Span generated for each event |
parentSpanId | Event | Parent-child span linkage |
source | Session | Ingestion mode (custom or otlp) |
Send an event:
{
  "type": "tool_call",
  "label": "Search API",
  "sequence": 2,
  "sections": [
    { "type": "input", "content": "{\"query\": \"...\"}" },
    { "type": "output", "content": "{\"results\": [...]}" }
  ]
}
End the session:
{
  "status": "completed",
  "summary": "Successfully researched the topic"
}
Dashboard APIs
| Endpoint | Purpose |
|---|---|
GET /api/tracing/sessions | Paginated session listing |
GET /api/tracing/sessions/:sessionId | Session detail with events |
GET /api/tracing/threads | Group sessions by thread |
GET /api/tracing/threads/:threadId | Thread detail |
GET /api/tracing/dashboard | Dashboard analytics |
GET /api/tracing/agents/:agentName/overview | Per-agent summary |
Built-in MCP — Console observability
Cognipeer ships a built-in MCP server that exposes the agent observability layer to agents themselves. This is how an agent can answer questions like "summarise my last 10 runs" or "look up session sess-… and tell me what failed" without any external integration.
The server is mounted under the client API as a normal MCP endpoint:
GET  /api/client/v1/mcp/console/sse
POST /api/client/v1/mcp/console/message
POST /api/client/v1/mcp/console/execute
Authentication is the same Bearer cpeer_… token used everywhere else; the project context is resolved from the token and applied to every tool call.
Tools exposed:
| Tool | Purpose |
|---|---|
list_recent_sessions | Filter by status, agent (exact/partial), or free-text search on sessionId/threadId/agent name. Capped at 100 sessions per call. |
get_session | Fetch a single session by sessionId including its event timeline. |
get_dashboard_overview | Rolled-up analytics for an ISO time window (sessions, tokens, top agents, top models, status distribution, daily trend). |
Attach the console MCP to an agent the same way you'd attach any other MCP server — the MCP API handshake (initialize, tools/list, tools/call) works identically.
Analytics
The getDashboardOverview method provides:
- Recent sessions and agents
- Total token usage
- Tool usage statistics
- Status distribution
- Model usage breakdown
- Daily usage trends
Background Processing
Tracing ingestion uses fireAndForget() for non-blocking processing:
fireAndForget('tracing-ingest', () =>
  ingestTracingSession(tenantDbName, sessionData)
);
This ensures the API response is not delayed by database writes.