
Build a dataset from production traffic
Two wizards turn traffic you already have into an evaluation dataset. Traffic Snapshots samples Console's own records — gateway request/response logs or agent tracing sessions. Import external data takes an export from somewhere else entirely — OpenAI, another gateway, Bedrock or Langfuse.
Both write into the same place (Evaluations → Datasets), and both sit behind the same mandatory PII gate: creation is rejected outright if you have not told it what to anonymise.
This page is the reference for both. If you want the narrative version — instrument an agent, sample it, compare models, cut tokens — read Cut token spend without losing quality instead; it uses these wizards as one step in a longer loop.
What you get
| Wizard | Route | Produces | Dataset source |
|---|---|---|---|
| Traffic Snapshots | /dashboard/evaluations/snapshots/new | Items sampled from gateway logs or agent traces, anonymised | generated |
| Import external data | /dashboard/evaluations/datasets/import | Items parsed from a .jsonl / .json / .txt export, anonymised | imported |
Both are community features. No Enterprise licence is involved.
Before you start
| You need | Detail |
|---|---|
| Traffic in the window, or an export file | Snapshots read what Console already recorded; imports read a file you supply |
| Evaluations write permission | Both wizards are gated on the evaluations service; a POST needs write |
| The right project selected | Both are project-scoped. Switch project in the header pill before you start — a dataset lands in the project that is active when you create it |
| For the tracing source: message content in your traces | Sessions are reconstructed from message sections. If your SDK is running with COGNIPEER_CAPTURE_CONTENT=metadata, there is nothing to reconstruct |
These are dashboard surfaces, not client-API surfaces
/api/snapshots* and /api/dataset-import* authenticate with a browser session, not with a cpeer_ token. There is no /api/client/v1 equivalent — the public evaluation API covers suites and runs only. Everything below that shows curl uses the session cookies, and is meant for scripting against your own logged-in session, not for machine-to-machine integration.
Traffic Snapshots
Where to start
| From | Control | Prefills |
|---|---|---|
| Evaluations → Datasets | Create from traffic | nothing |
| Agent Observability → Sessions (the Session Explorer page) | Create snapshot from traffic | ?source=tracing, plus the agent if a filter is active |
The wizard also accepts ?source=, ?from=, ?to=, ?model=, ?agent= and ?status= directly, which is the supported way to link into it from your own tooling.
It opens as a full-screen wizard titled Traffic Snapshots — "Sample production traffic into an evaluation dataset" — with five sections and a running summary down the right-hand side. A section's number turns into a tick once it is complete.
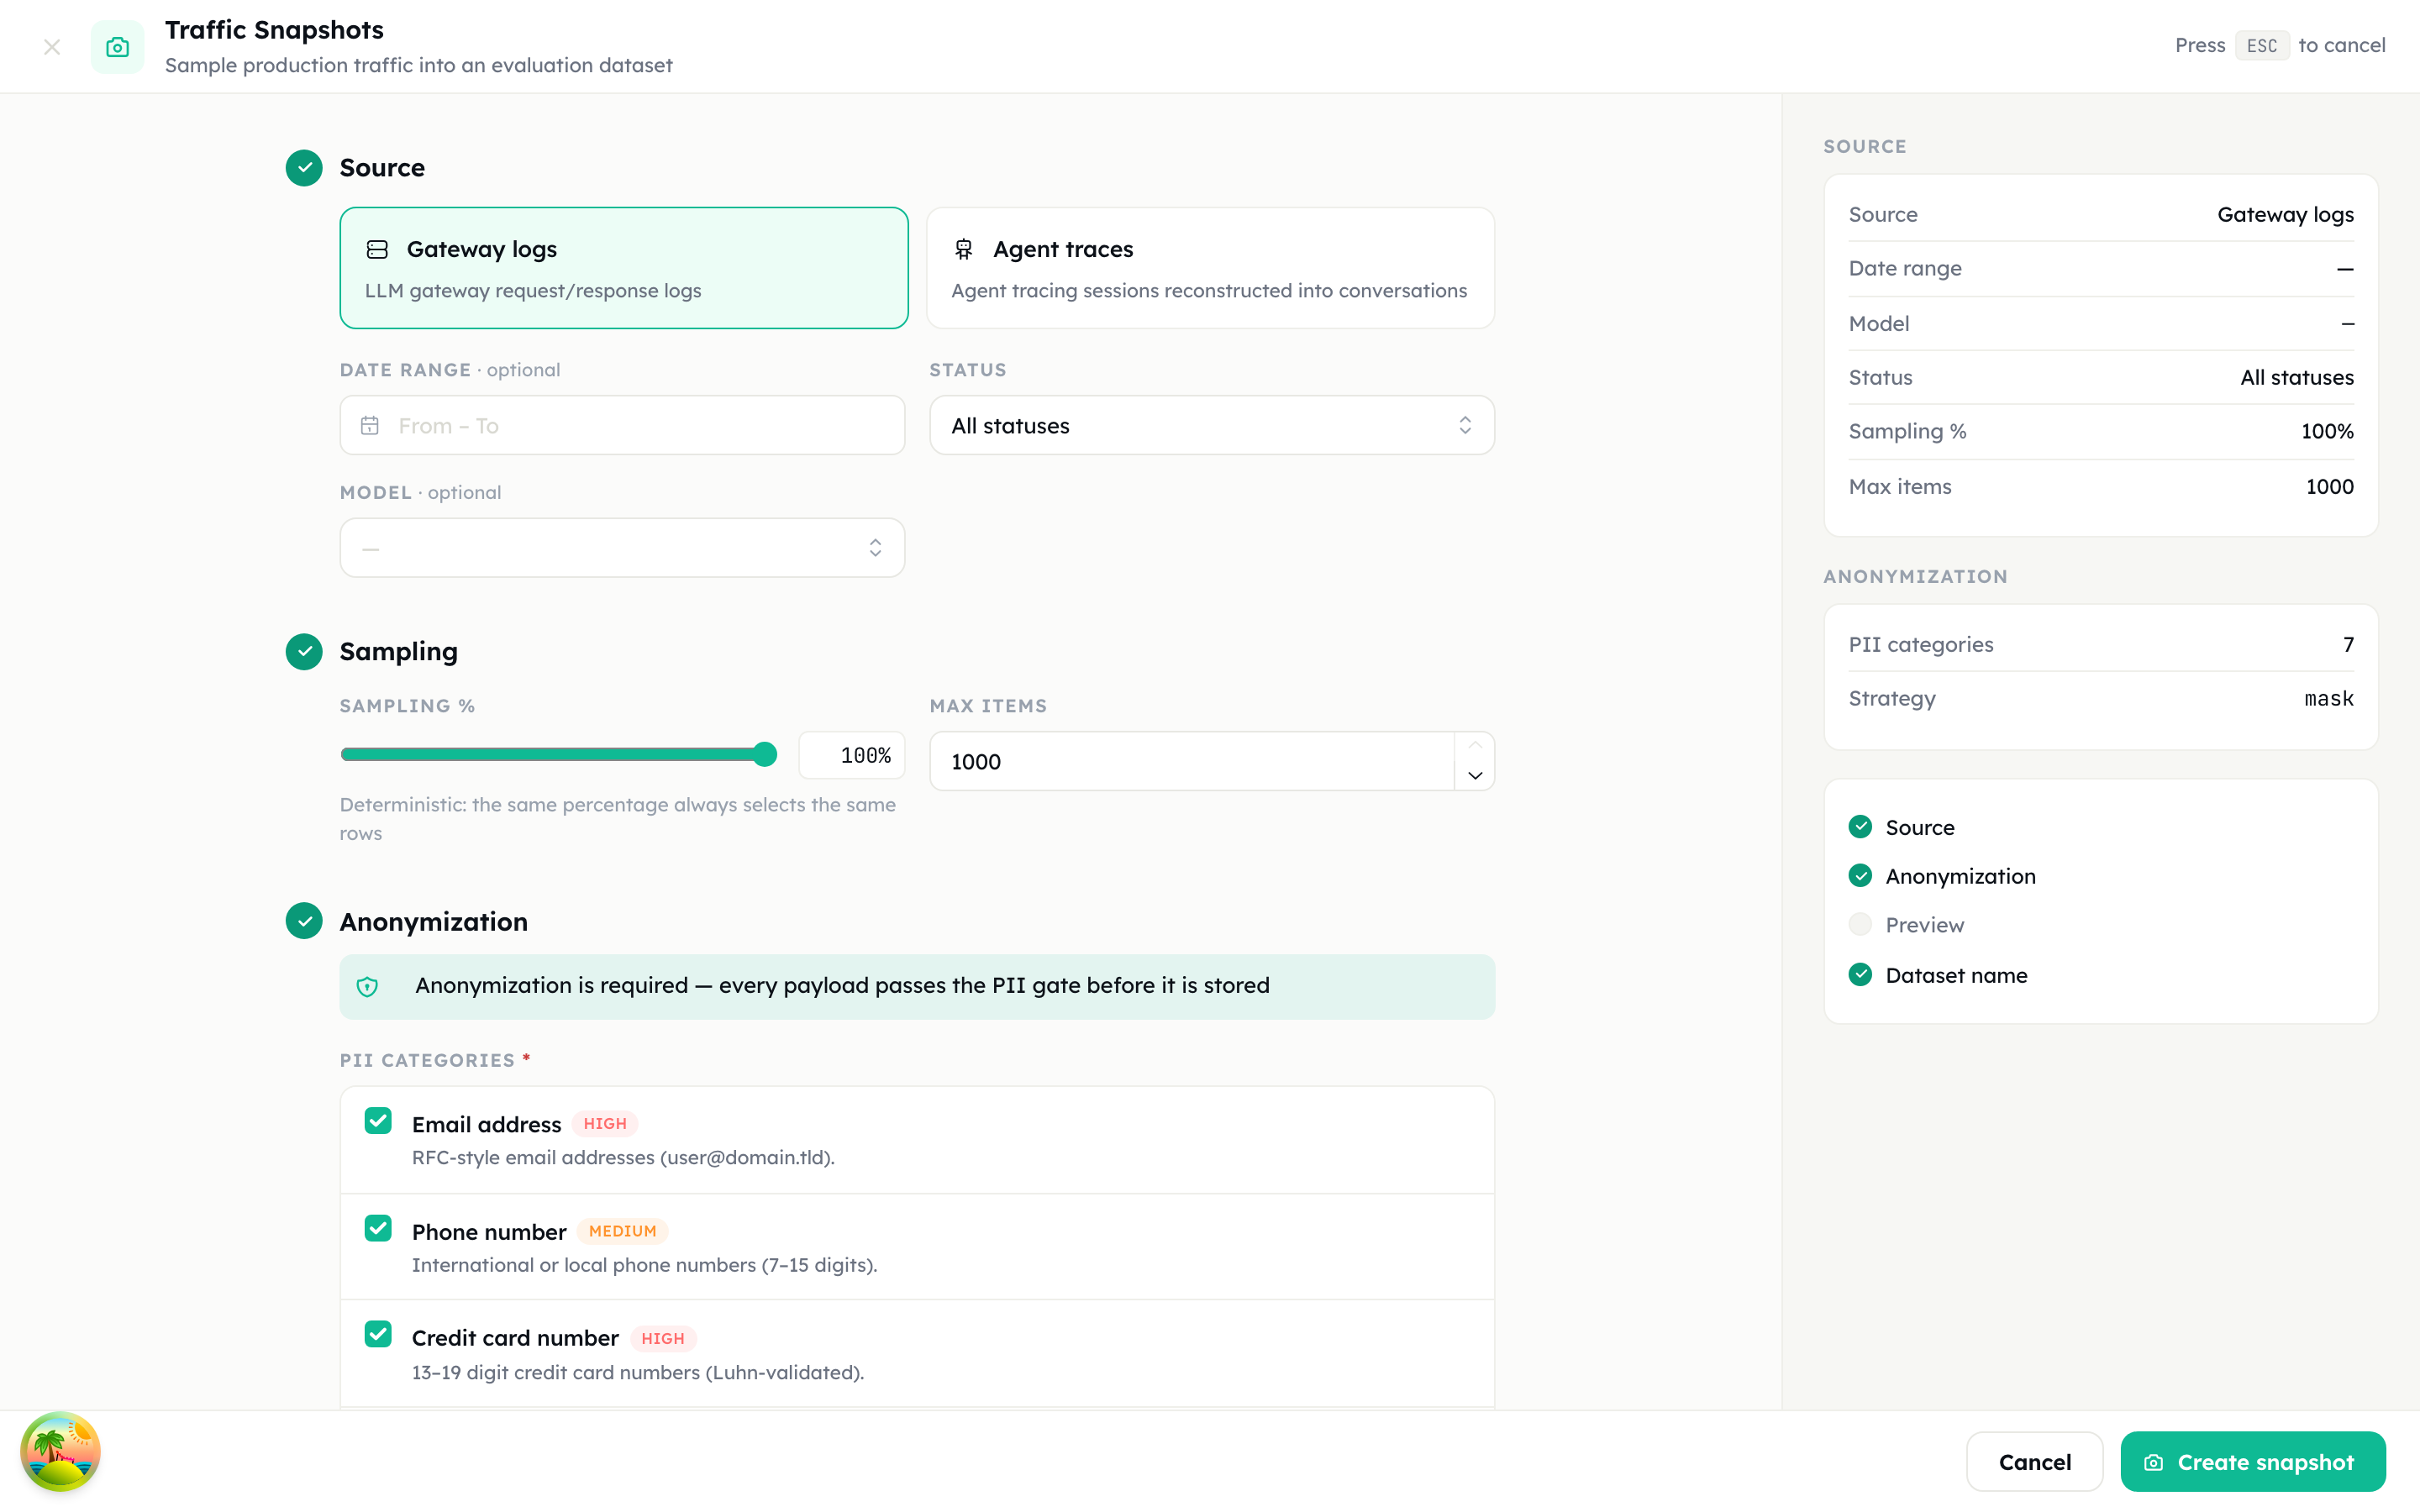
1. Source
Pick one of two source cards. They read different collections and produce differently-shaped items.
| Card | Reads | Item shape |
|---|---|---|
| Gateway logs (LLM gateway request/response logs) | Model usage logs written by the inference gateway | One item per logged request |
| Agent traces (Agent tracing sessions reconstructed into conversations) | Tracing sessions and their events | Up to four items per session — the final answer plus the last three tool-call decisions |
Then narrow it:
| Field | Applies to | Notes |
|---|---|---|
| Date range | both | Optional. The picked end date is extended to the last millisecond of that day |
| Status | both | All statuses / Success / Error. For traces, both error and failed count as Error |
| Model | Gateway logs | The model's key from the Model Hub |
| Agent | Agent traces | Exact agent name |
The Model and Agent dropdowns are not catalogues of everything you own — they are built from the usage rollup for the last 90 days, so they list models the gateway actually served and agent names that actually appear in traces. An empty dropdown means that kind of traffic does not exist in the window, not that the feature is broken. A value passed in through ?agent= stays selectable even when it is older than that window.
Snapshot one model at a time
The recorded response becomes the reference answer. A snapshot spanning three models produces reference answers from three different models, and any comparison you run on it afterwards measures nothing in particular.
2. Sampling
| Field | Range | Default |
|---|---|---|
| Sampling % | 1–100 | 100 |
| Max items | 1–1000 | 1000 (also the server-side hard cap) |
Sampling is deterministic, exactly as the hint says — "Deterministic: the same percentage always selects the same rows". A row is in the sample when
uint32BE(sha256(stableId)[0..4]) % 100 < samplePctwhere stableId is the request id for gateway rows and the session id for tracing sessions. Two consequences worth relying on:
- re-running the same snapshot picks the same rows, so a dataset is reproducible from its provenance metadata alone;
- the sample is nested — everything selected at 10% is also selected at 50%. Widening a snapshot adds rows, it never swaps them out.
Max items caps dataset items, not source rows. For the tracing source one session can emit up to four items, so the cap is reached after roughly a quarter as many sessions.
3. Anonymization
This section is not optional. The banner states it — "Anonymization is required — every payload passes the PII gate before it is stored" — and the server enforces it: a create call without an anonymize block is rejected with HTTP 400, and so is one with no categories selected or a strategy other than mask / pseudonym.
PII categories lists the 18 built-in categories, each with its severity badge. Seven are pre-selected (email, phone, credit card, IBAN, and the Turkish TCKN / phone / IBAN categories). At least one must stay selected. Category definitions live in PII Service.
Strategy decides what replaces each finding.
| Strategy | Output | Behaviour |
|---|---|---|
| Mask (partial, e.g. j***@domain.com) | j***@domain.com | Each finding is replaced using its own category's mask rule — keep the domain for an email, the last four digits for a card or phone, a fixed placeholder for an address |
Pseudonym (deterministic tokens, e.g. <EMAIL_a1b2c3>) | <EMAIL_a1b2c3> | Each finding is replaced with <CATEGORY_hhhhhh>, where the six hex characters are the head of HMAC-SHA256(salt, value) |
For anything you intend to evaluate on, choose Pseudonym. The token is a pure function of the value, so the same person is the same token everywhere in the conversation: "email <EMAIL_a1b2c3> … reply to <EMAIL_a1b2c3>" still reads as one coherent exchange. Masking destroys that link — an email keeps only its first character and its domain, so two different customers can collapse onto the same j***@domain.com and nothing in the output tells you whether two masked values were the same person. Co-reference is what keeps a sampled conversation semantically evaluable.
Pseudonyms are irreversible in the ordinary sense: recovering the value needs the salt and a candidate list to hash against. There is no vault and no detokenise call for snapshots — that is a different feature of the PII Service, not this one.
The salt contract
Stable salt appears only in pseudonym mode. Its hint is the whole contract: "The same salt keeps pseudonym tokens consistent across snapshots. Leave empty to use a fresh server-generated salt for this run (never stored)."
| You supply | What happens |
|---|---|
| A salt of your own | Tokens line up across every snapshot you create with that salt — the same customer is <EMAIL_a1b2c3> in all of them |
| Nothing (Server-generated) | The background job generates a random salt at run time, uses it, and discards it |
The salt is never written to the dataset, never stored beside the output, and never echoed back by the API. The provenance metadata records the strategy, the category list and the custom-pattern count — never the salt. Keep your own copy if you want cross-snapshot consistency later; there is no way to recover it from Console afterwards.
4. Preview
Preview runs a counting pass. It never loads or returns payload content, so it is safe to run repeatedly. Any change to a filter above invalidates the result and you have to run it again.
| Tile | Meaning |
|---|---|
| Matching | Rows (or sessions) that pass the filters within the scanned window |
| Would sample | Of those, how many the deterministic sample selects |
| Would create | Lower bound on items — min(sampled, max items) |
| Scanned | Rows or sessions actually examined |
Below the tiles, a breakdown table splits Matching and Would sample per model (gateway) or per agent (traces).
Two honest caveats:
- Would create is a floor for the tracing source. The preview deliberately never loads trace events, so it counts one item per session. A session with tool calls emits up to four. The created dataset's metadata records the real ratio as
counts.itemsPerSession. - Scanning is capped at 5,000 rows. When the cap is hit you get the orange banner "Scan cap reached — counts are partial", and every number on the screen is a lower bound. Gateway rows are walked model by model, newest first, so a capped scan means the models later in the list contributed nothing at all. Narrow the date range or pick a specific Model and run it again.
Running a preview is not mandatory — Create snapshot stays enabled without it. Run it anyway; it is the only chance to notice you are about to snapshot 4 rows or 40,000.
5. Create snapshot
Dataset name is pre-filled as snapshot <source> <dates> and is editable; Description is optional. Create snapshot returns immediately with HTTP 202 — the scan runs on a queue, because large tracing snapshots used to die on proxy timeouts.
The wizard then shows Snapshot is being created in the background with a Queued or Running badge, and "You can close this page — the dataset appears in the list with a live status and fills in when the job completes." That is accurate: the dataset row exists immediately and shows Snapshotting… in the Items column until the job finishes. On failure the row shows Failed, and the dataset's own page carries a red Traffic snapshot failed alert with the error.
When it completes you get the counts — matching, would sample, Items created, the skip reasons and PII findings replaced — and an Open dataset button. Payload budget reached is listed only when it is non-zero; the other three skip rows are always shown.
What ends up in an item
| Gateway logs | Agent traces | |
|---|---|---|
| Item id | gw-<requestId> | tr-<sessionId> for the answer, tr-<sessionId>#N for tool decisions |
input | The recorded request messages, tool turns included | The reconstructed conversation up to that decision point |
expected.reference | The recorded assistant text, when there was any | The final assistant message |
expected.toolCalls | The recorded tool calls (argsMatch: 'subset') | The tool calls that decision issued |
tools | never — see below | The recorded tool menu for that turn, or one inferred from the calls observed |
tags | snapshot, gateway, model:<key> | snapshot, tracing, agent:<name> |
Items also pick up a lang:<iso> tag, derived from the human turns in the conversation. Items whose language cannot be classified are left untagged rather than guessed.
Why the language tag matters
A quality verdict averaged over mixed-language traffic hides the thing you most need to see. Plenty of models are documented on English benchmarks and degrade elsewhere, so a candidate can pass overall while failing badly on a quarter of your traffic. Tagging at snapshot time means a later evaluation, parity test or model matrix can be read per language — which turns "this model is fine" into "this model is fine in English and not in Turkish".
Every string is scrubbed by the persisted-log redactor first and anonymised second, then capped at 16,000 characters with a trailing …[truncated]. Both non-streamed and streamed gateway responses are read, so streaming traffic — which is most traffic — still yields a reference answer.
To check what you actually got, open the dataset: the item grid's Expected column badges each row reference, tool calls or assertions, and Tools gives the size of the tool menu.
Skipped rows
The completion screen breaks skips down by reason. This is the part people skim, and it is the part that decides whether your numbers mean anything.
| Counter | Source | Cause |
|---|---|---|
| Truncated payloads | gateway | The stored payload was truncated by the log redactor's size cap, or does not parse as JSON |
| No messages | gateway | The request carried no usable messages array. Embedding, audio and OCR rows land here — the gateway scan walks every model's log stream, not only chat models |
| Not reconstructable | traces | The session had no message sections to rebuild a conversation from |
| Payload budget reached | both | The serialised items hit the snapshot's 8 MB payload budget and the scan stopped |
Skipped counters mean your dataset is a biased sample
These are not cosmetic. Not reconstructable removes exactly the sessions your instrumentation records badly; Payload budget reached removes the longest conversations, which are also the most expensive and the most interesting. Neither is a random dropout, so what remains is not a random sample of your traffic.
Payload budget reached additionally under-reports: it stops the scan, so the number you see counts the item that broke the budget (plus the rest of that session, for traces) and nothing that was never reached. A non-zero value means "truncated here", not "this many rows lost".
Report these counters next to any result you publish from the dataset.
The same thing over the API
Three routes, all under the dashboard /api tree, all authenticated with the session cookies (token and active_project_id) and gated on evaluations — read for GET, write for POST.
| Method | Endpoint | Purpose |
|---|---|---|
GET | /api/snapshots/filters | The Model and Agent dropdown options, from the usage rollup |
POST | /api/snapshots/preview | Counts and breakdown only; never returns payloads |
POST | /api/snapshots | Enqueue the job; returns 202 with datasetId |
curl -s https://<your-host>/api/snapshots/preview \
  -b "token=$SESSION; active_project_id=$PROJECT" \
  -H 'Content-Type: application/json' \
  -d '{
        "source": "gateway",
        "from": "2026-08-01T00:00:00.000Z",
        "to":   "2026-08-15T23:59:59.999Z",
        "modelKey": "chat-small",
        "status": "success",
        "samplePct": 40,
        "limit": 500
}'curl -s https://<your-host>/api/snapshots \
-b "token=$SESSION; active_project_id=$PROJECT" \
-H 'Content-Type: application/json' \
-d '{
"source": "gateway",
"modelKey": "chat-small",
"samplePct": 40,
"limit": 500,
"name": "gateway aug 1-15",
"anonymize": {
"categories": ["email", "phone", "creditCard", "iban"],
"strategy": "pseudonym",
"salt": "keep-this-somewhere-safe"
}
}'source must be gateway or tracing, name is required, and anonymize is required with a valid strategy — each of those is a separate 400 with a message naming the field. Poll GET /api/evaluation/datasets/<datasetId> and watch metadata.snapshot.status go pending → running → ready (or failed, with metadata.snapshot.error).
The finished metadata.snapshot block is the provenance record: source, filters, samplePct, limit, counts (matching / sampled / created / skipped, plus itemsPerSession for traces), the anonymisation strategy and category list, piiFindings, and the job timestamps. No salt.
Import external data
Use this when the traffic you want is not in Console — a fine-tune file, a gateway's log export, Bedrock invocation logs, a Langfuse dump.
Evaluations → Datasets → Import opens the wizard titled Import external data — "Bring OpenAI, gateway, Bedrock, or Langfuse exports in as an evaluation dataset".
1. Source
Three ways in. Whichever one fills last wins, and the badge under the fields always shows the effective content's size and origin (Pasted text, File upload or URL fetch).
| Field | Notes |
|---|---|
| Paste export content | Monospace textarea. Fine for a few hundred lines |
| Upload a file | ".jsonl, .json or .txt — up to 10MB". Read in the browser; oversized files are rejected before anything is sent |
| Fetch from URL + Fetch | "Fetched server-side (SSRF-guarded), 10MB cap" |
The URL fetch goes through the shared outbound guard: http/https only, DNS-resolved and rejected if it lands on loopback, private, link-local, CGNAT or cloud-metadata address space, with every redirect hop re-checked. A pre-signed URL to object storage works; http://169.254.169.254/… does not.
The 10 MB cap is enforced in three places — the file picker, the server-side fetch, and the parser itself (HTTP 413). It is measured in UTF-8 bytes.
2. Format & preview
Detection runs automatically, debounced, against the first ~50 records, and only returns a format when every classifiable record agrees. Mixed or unrecognised content shows Not recognized — pick a format manually; Format override then forces one.
| Format | Wire id | Shape |
|---|---|---|
| OpenAI chat JSONL (fine-tune / stored completions) | openai-chat-jsonl | One {messages: [...]} per line, optional tools; a trailing assistant message becomes the expectation |
| OpenAI request/response JSONL | openai-pair-jsonl | Each line pairs a request carrying messages[] with a response carrying choices[] (request/response, input/output or body/completion; values may be objects or JSON strings) |
| Bedrock invocation logs (JSONL) | bedrock-invocation-jsonl | modelId plus input.inputBodyJson / output.outputBodyJson in Anthropic-native shape; tool_use blocks map to expected tool calls |
| Langfuse generations | langfuse-generations | JSON array or JSONL of generation observations; input may be messages[], {messages} or a bare string |
| Embedded chat JSON (gateway/APIM) | embedded-chat-json | Fallback: each record is deep-walked, JSON-looking strings included, to the first object carrying messages[] and the first carrying choices[], however deeply nested |
Langfuse and embedded-chat exports also parse as a single JSON array or one pretty-printed object; the others are read line by line, so a 10 MB JSONL file is never parsed as one document.
The preview shows Parsed and Skipped counters, a badge per skip reason (unparseable, missingMessages, emptyInput, overLimit), and the first five items with their messages, tool count, whether a reference was recovered, and how many expected tool calls were found.
The preview is raw
"Raw preview — these rows are shown exactly as parsed and are NOT yet anonymized. Nothing shown here is persisted." Exactly that: the detect endpoint parses and returns, and stores nothing. Anonymisation happens at create time. If your export contains personal data, treat this screen accordingly.
A single import creates at most 5,000 items; anything past that is counted as overLimit and parsing stops there.
3. Anonymization
The same gate, the same enforcement, the same salt contract as snapshots — "Imported content is anonymized before it is stored. Select at least one PII category." The strategy labels are worded differently here (Mask — replace findings with category placeholders and Pseudonym — replace findings with stable fake tokens) but the behaviour and the reasoning are identical. Stable salt again appears only for pseudonym mode, and is again never stored.
Note the one difference from snapshots: imported strings are scrubbed and anonymised, but not truncated at 16,000 characters.
4. Create dataset
Dataset name is required and pre-filled from the detected format. Source label is a free-text provenance tag — "Free-form origin tag, e.g. "azure-apim prod"" — worth filling in, because it is the only human-readable trace of where the file came from.
Unlike a snapshot, an import runs synchronously and returns 201 with the counts. A 10 MB file with thousands of records takes a while; leave the tab open.
Items are tagged imported, format:<wire id> and, when the export named one, model:<id>. The dataset's metadata records the format, the source label, a SHA-256 of the raw content, the parse counts, the anonymisation settings and the PII-finding total — the content hash lets you prove two datasets came from the same export without keeping the export.
Imports never touch cost reporting
"Imported rows are evaluation data only — they never affect usage or cost reporting. Measured costs come later from eval replay." The import path writes no usage or spend rows, by design. Importing a year of someone else's logs will not move a single number on your cost screens.
The same thing over the API
| Method | Endpoint | Purpose |
|---|---|---|
POST | /api/dataset-import/detect | Sniff the format, return the first five parsed items and the counts. Persists nothing |
POST | /api/dataset-import/fetch | SSRF-guarded server-side GET of an export URL; returns the text |
POST | /api/dataset-import | Parse, anonymise, create. Returns 201 |
curl -s https://<your-host>/api/dataset-import \
  -b "token=$SESSION; active_project_id=$PROJECT" \
  -H 'Content-Type: application/json' \
  -d @- <<'JSON'
{
  "content": "{\"messages\":[{\"role\":\"user\",\"content\":\"hello\"},{\"role\":\"assistant\",\"content\":\"hi\"}]}",
  "format": "openai-chat-jsonl",
  "name": "openai export aug",
  "sourceLabel": "azure-apim prod",
  "anonymize": {
    "categories": ["email", "phone"],
    "strategy": "pseudonym"
  }
}
JSON
format must be one of the five wire ids, content and name are required, and anonymize is required with a mask or pseudonym strategy. Content over 10 MB returns 413.
Grading what you built
A snapshot dataset is not uniform, and the scorer you pick has to match what each item actually contains.
Tool-call turns carry no reference answer
When the production response at that turn was a tool call rather than text, the item gets expected.toolCalls and no expected.reference. The semantic scorer requires a reference: with none present it returns score: 0, passed: false and the error "semantic scorer requires expected.reference (the gold answer) on the dataset item" — regardless of how good the candidate's answer was.
A mixed dataset scored with semantic alone therefore reports a pass rate ceiling equal to the fraction of items that have a reference, and every model you compare hits the same ceiling. It looks like a quality problem. It is a dataset-shape problem.
Grade those items with the tool-call scorer, or filter them out of the dataset first. The Expected column on the dataset page tells you the split: reference versus tool calls.
| Scorer | Needs on the item | Behaviour when it is missing |
|---|---|---|
semantic | expected.reference | Scores 0 with an explanatory error |
tool-call | expected.toolCalls | No expected and no actual calls scores 1 — correct abstention |
llm-judge | A rubric; the reference is used when present | Works without a reference |
assertion | Assertions on the item | Snapshot and import items carry none — every item passes, measuring nothing |
Gateway logs record no tool definitions
The gateway logs the model key, the messages and the resolved settings — it does not log the tools array. Gateway-sourced items therefore have no tool menu, and a candidate evaluated on them is being asked to make a tool decision without being shown the tools.
Only the tracing source can carry a menu: it prefers the recorded tool_definitions sections (which ride per model-call event, so a menu that changed between turns is reproduced per turn) and falls back to definitions inferred from the calls it observed. If you are evaluating tool selection, snapshot Agent traces, not Gateway logs.
Scorers, suites and runs in full: Evaluation & Analysis.
Things that will bite you
| Anonymisation is not skippable | No anonymize, no categories, or a bad strategy — all HTTP 400 |
| The salt is never stored | Keep your own copy, or pseudonyms will not line up with the next snapshot |
| Preview is optional but not pointless | Create snapshot works without it; you then find out the size afterwards |
| Would create under-counts for traces | It counts sessions; a session emits up to four items |
| The scan cap is 5,000 rows | Gateway rows are walked model by model — a capped scan can miss whole models |
| Max items caps items, not sessions | 1,000 is both the default and the hard cap |
| Skipped counters mean bias | Especially Not reconstructable and Payload budget reached |
| Gateway logs carry no tool definitions | Use the tracing source when tool decisions matter |
| Tool-call turns have no reference | Score them with tool-call, not semantic |
An assertion scorer on these datasets always passes | 100% pass rate, zero information |
| Imports are synchronous | 10 MB, up to 5,000 items, in one request |
| Snapshots truncate long strings at 16,000 characters | Imports do not |
Where to go next
- Cut token spend without losing quality — the loop this dataset feeds
- Evaluation & Analysis — targets, suites, scorers and runs
- PII Service — the category catalogue behind the anonymisation gate
- Agent Tracing — what a session has to contain to be reconstructable