
Monitoring & Observability
Cognipeer Console provides structured logging, health checks, and usage tracking for production observability. The operator-facing surfaces for this live under Operate → Alerts & Incidents, Configure → Audit Log, and Configure → License.
Alerts & Incidents
This is where you define threshold-based rules that trigger when a metric crosses a configured boundary. Rules are grouped by signal source — Model Hub, Model Monitoring, Guardrail, Knowledge Engine, MCP Servers — so you can target a specific subsystem.
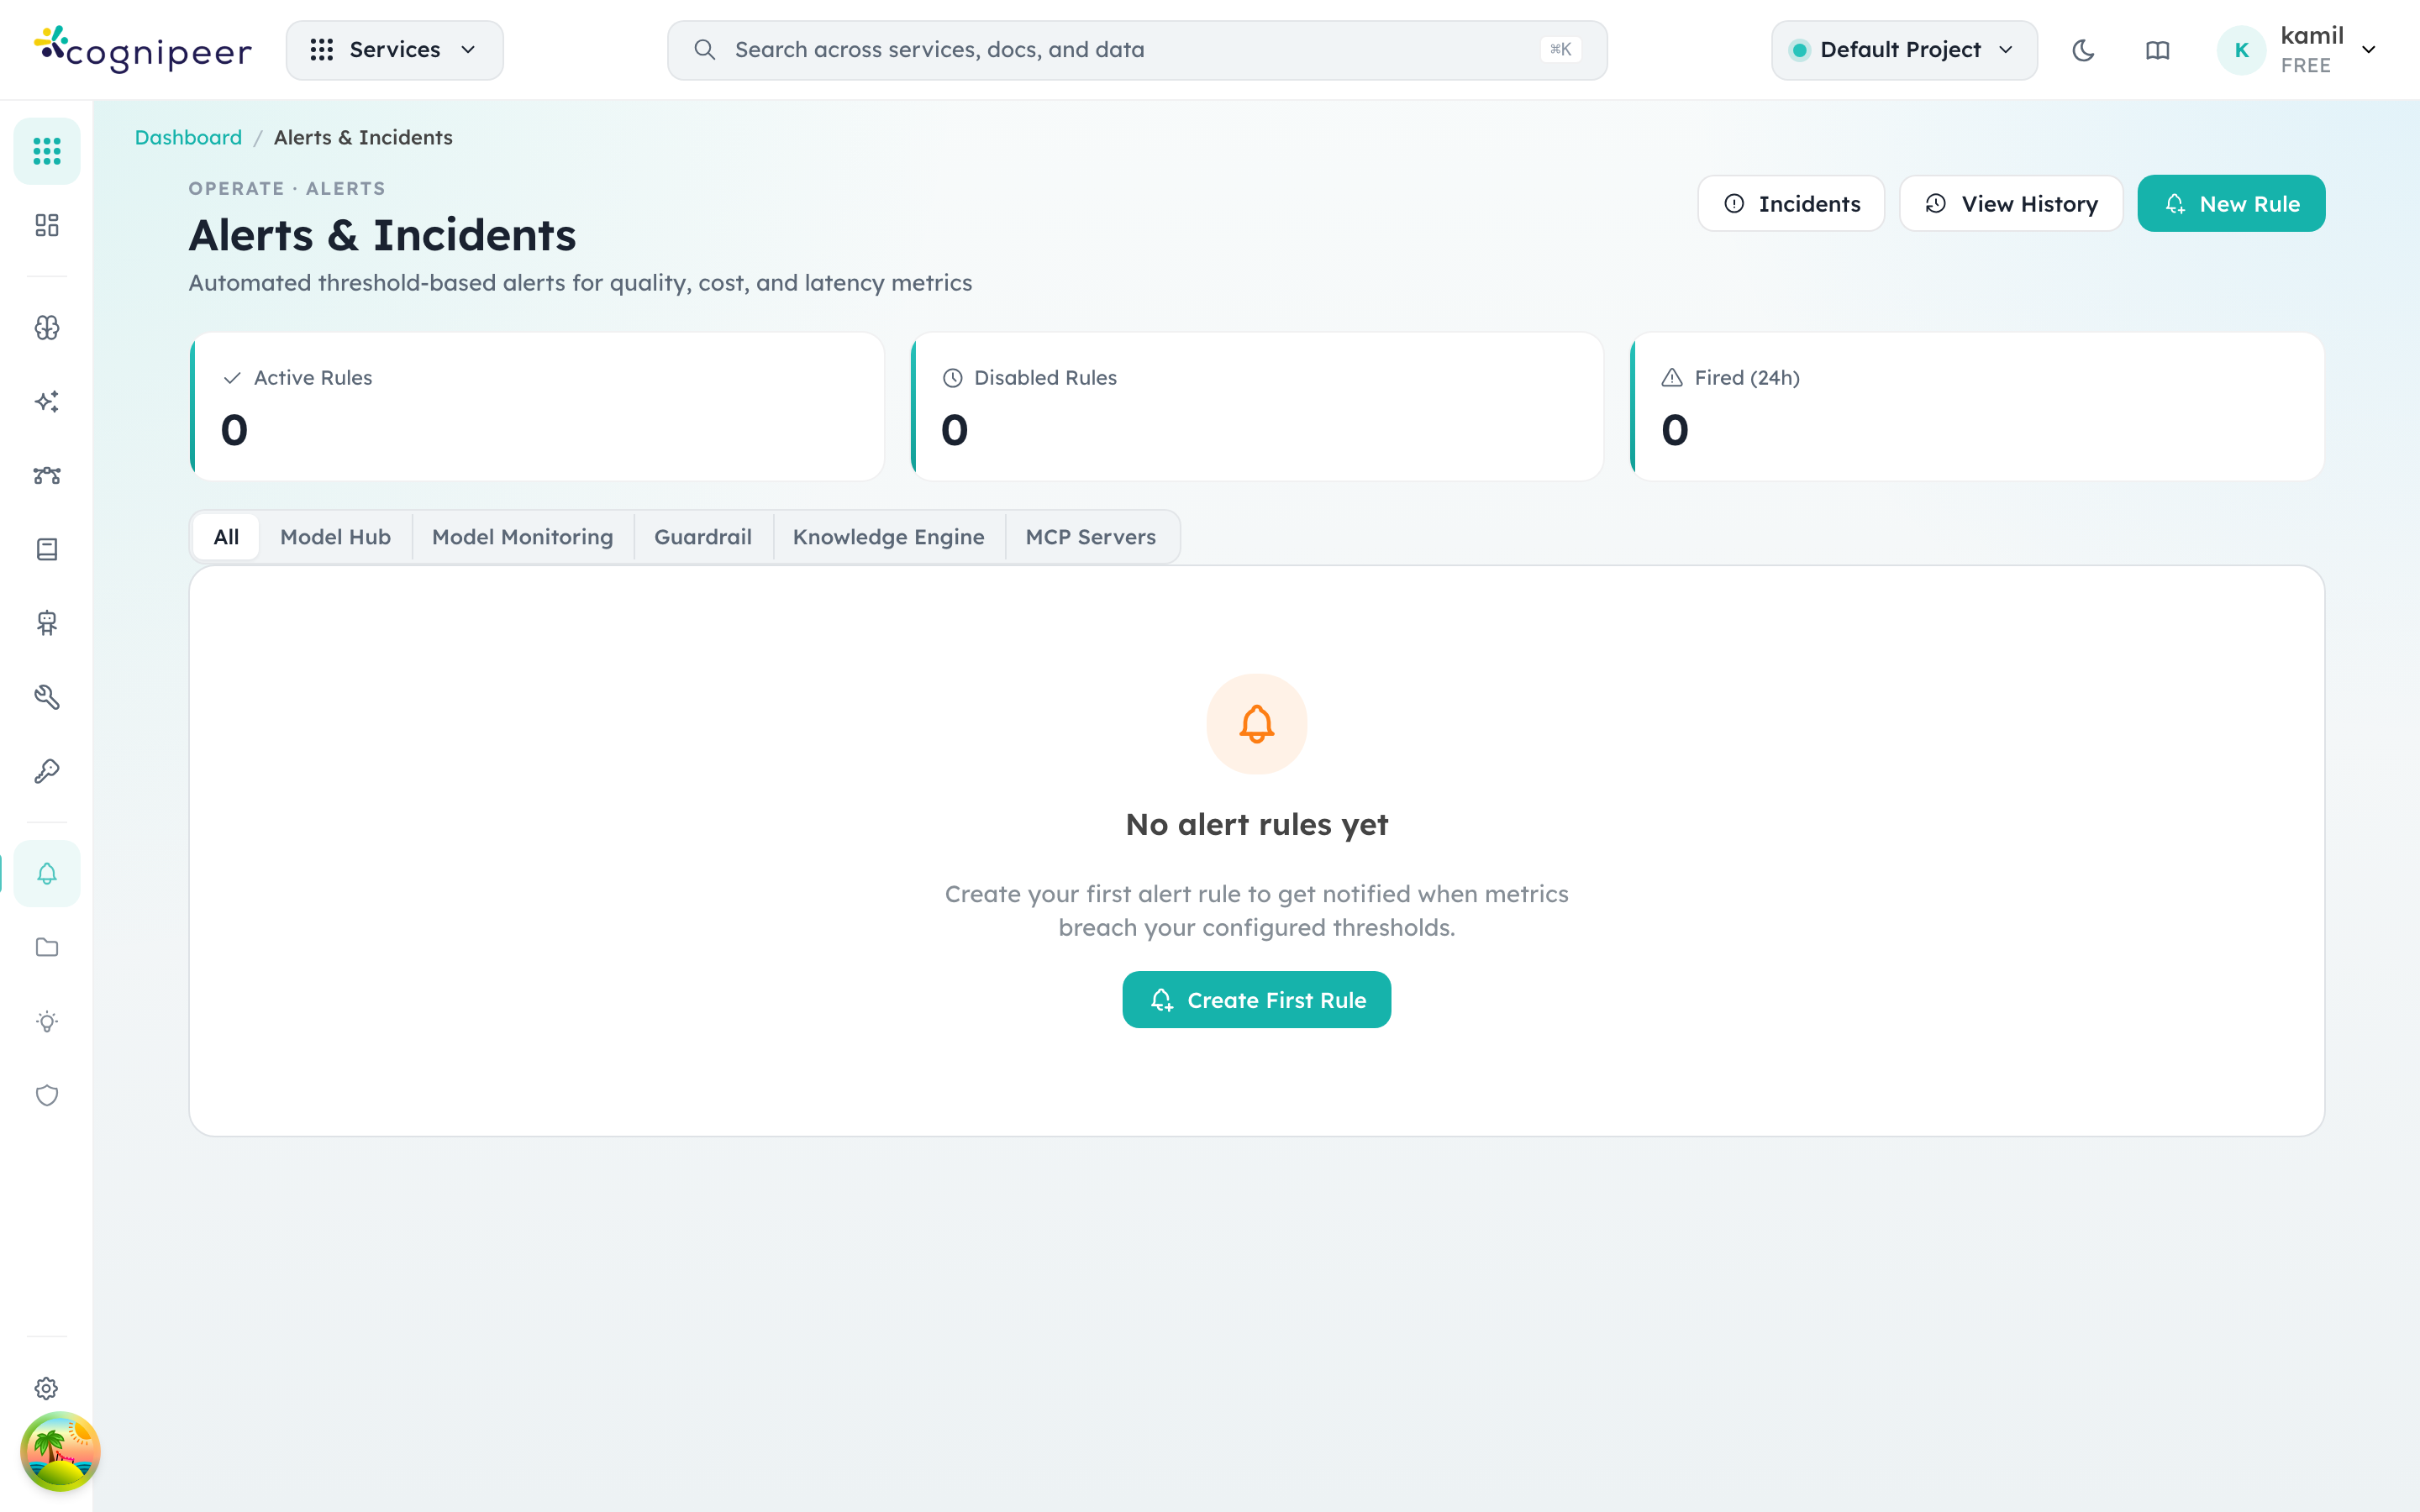
The three counters at the top capture the operational state at a glance: how many rules are active, how many are disabled, and how many fired in the last 24 hours. From here you can either author a rule (New Rule), inspect open incidents that need acknowledgement (Incidents), or jump to the full audit timeline (View History).
Alert history
The history view shows every firing event, who acknowledged it, and how it resolved. Filters let you scope by rule, severity, source, or date range.
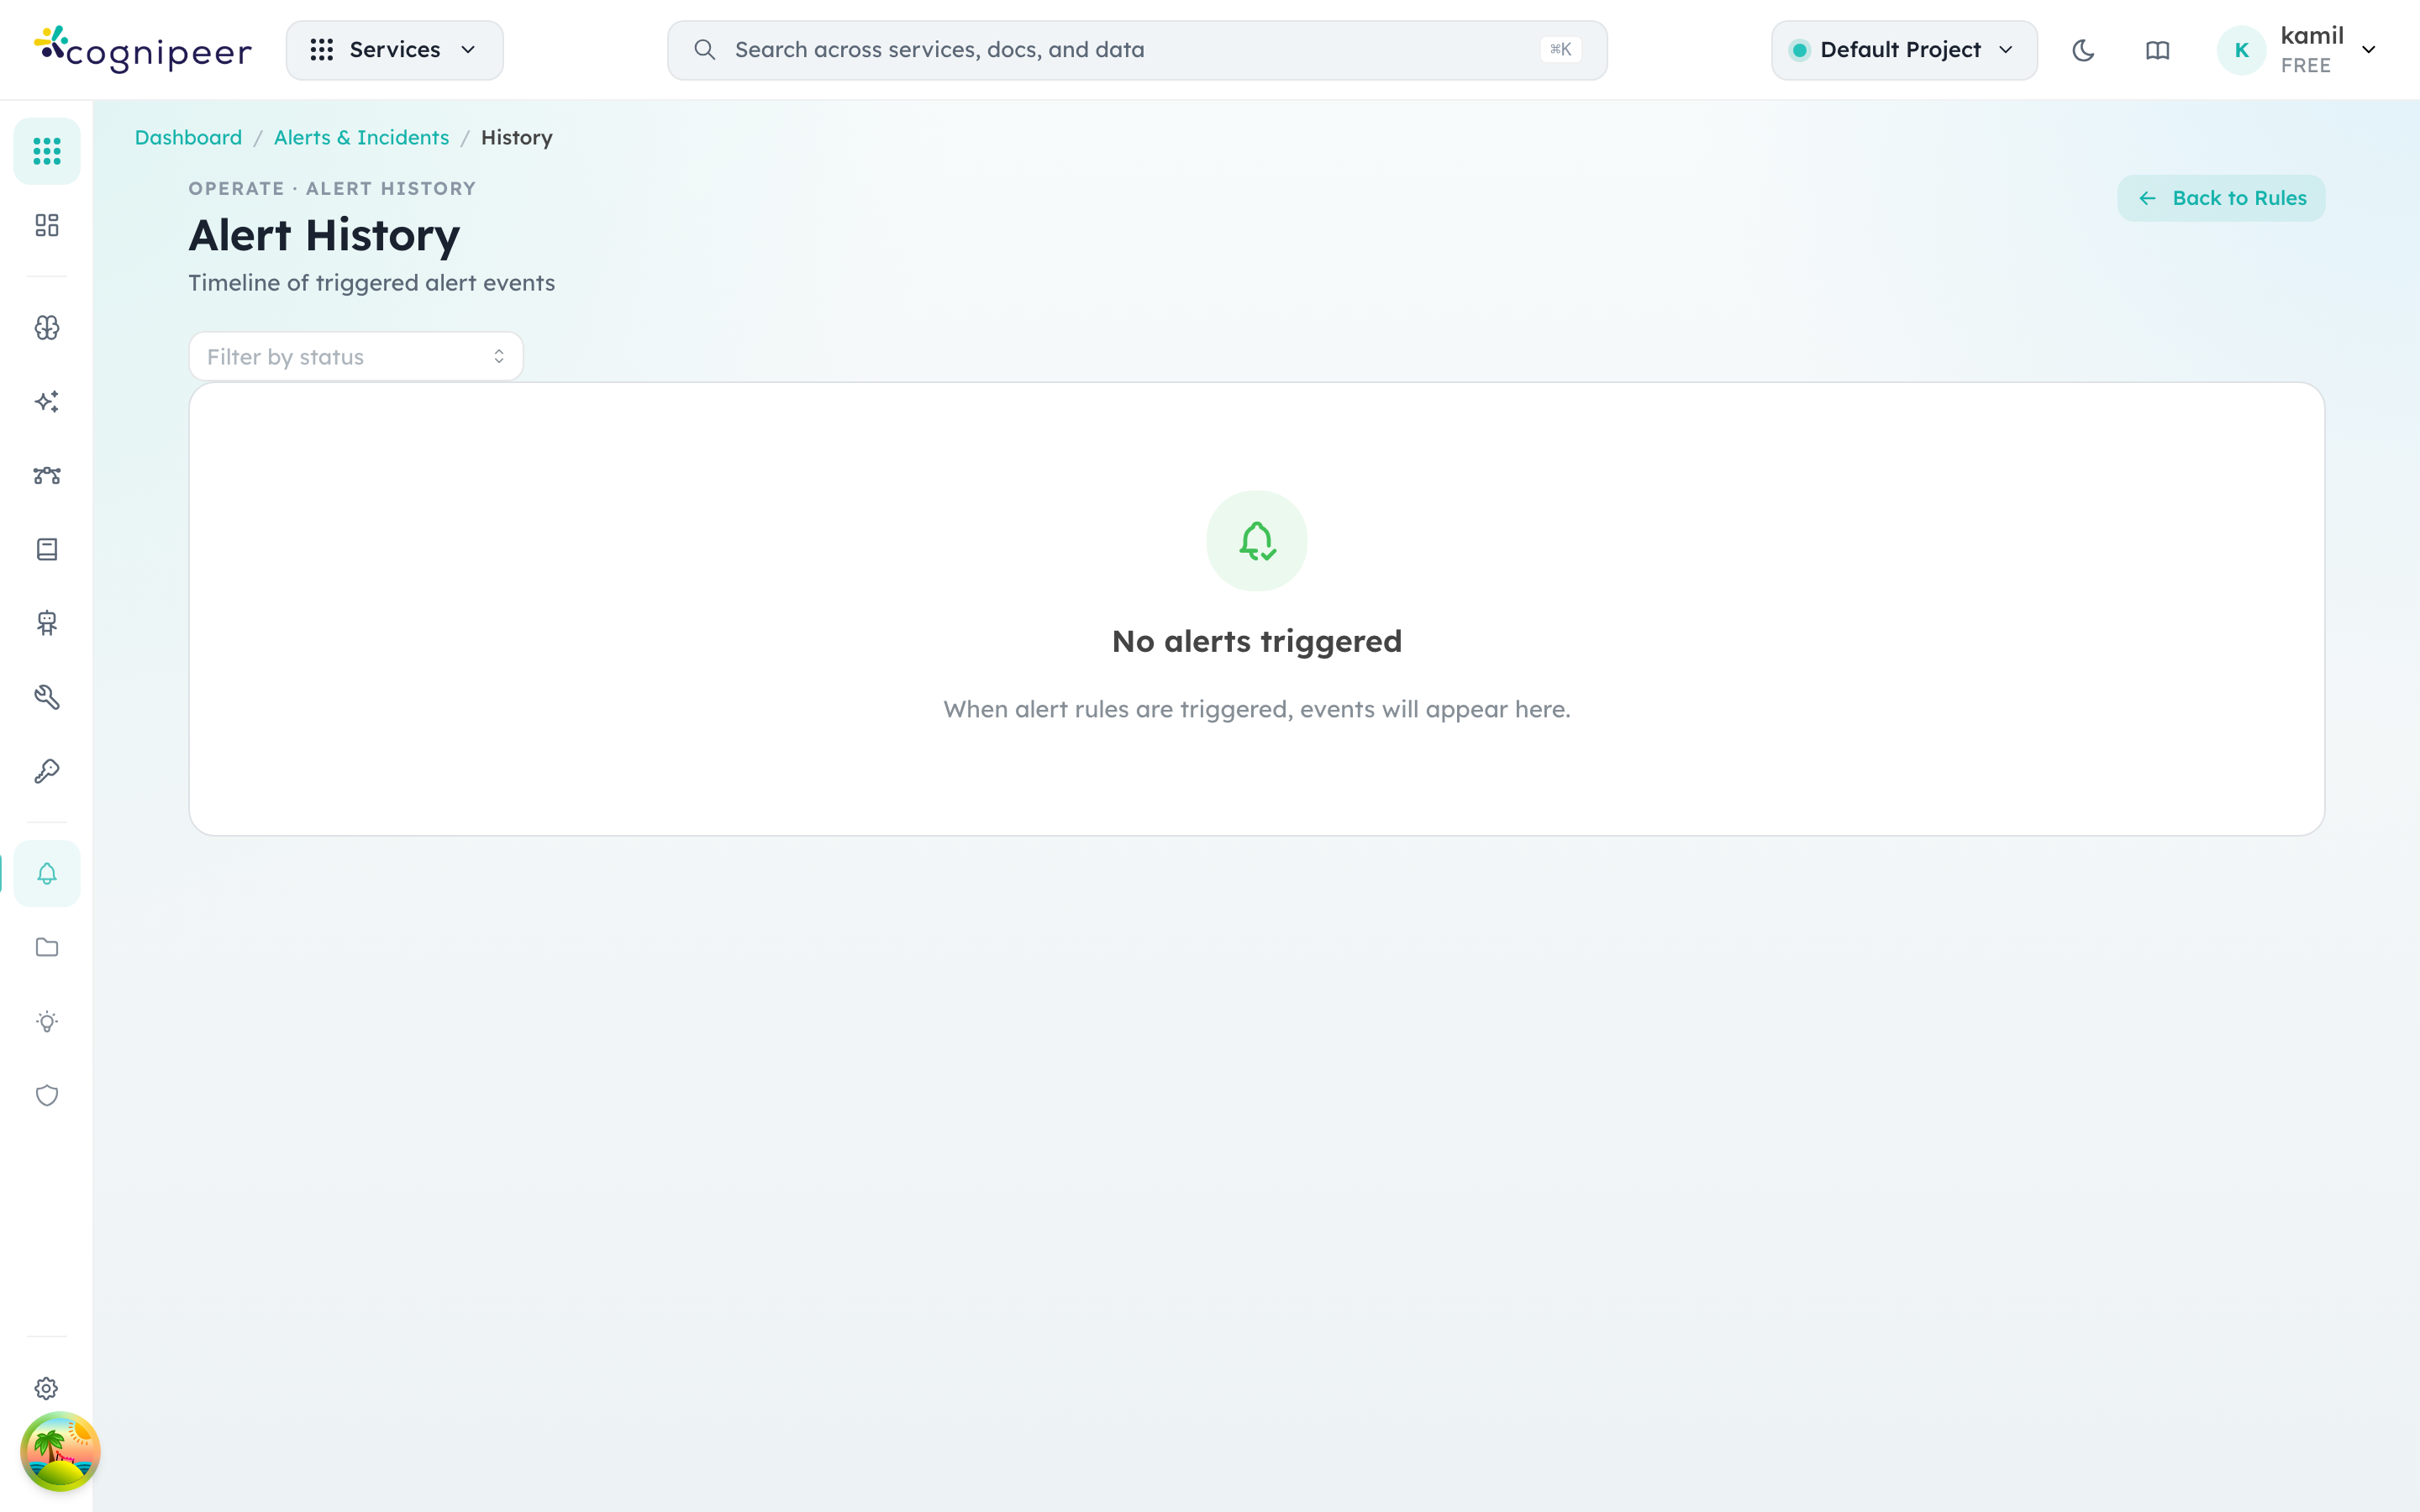
Each row links back to the underlying signal — for an inference alert that's a model in Model Hub, for a guardrail alert that's the policy in Guardrails — so triage stays one click away from the configuration that triggered it.
Audit Log
Every state-changing action on the console — provider edits, model deployments, prompt promotions, token issuance, license updates, member changes — is recorded in the tenant audit log.
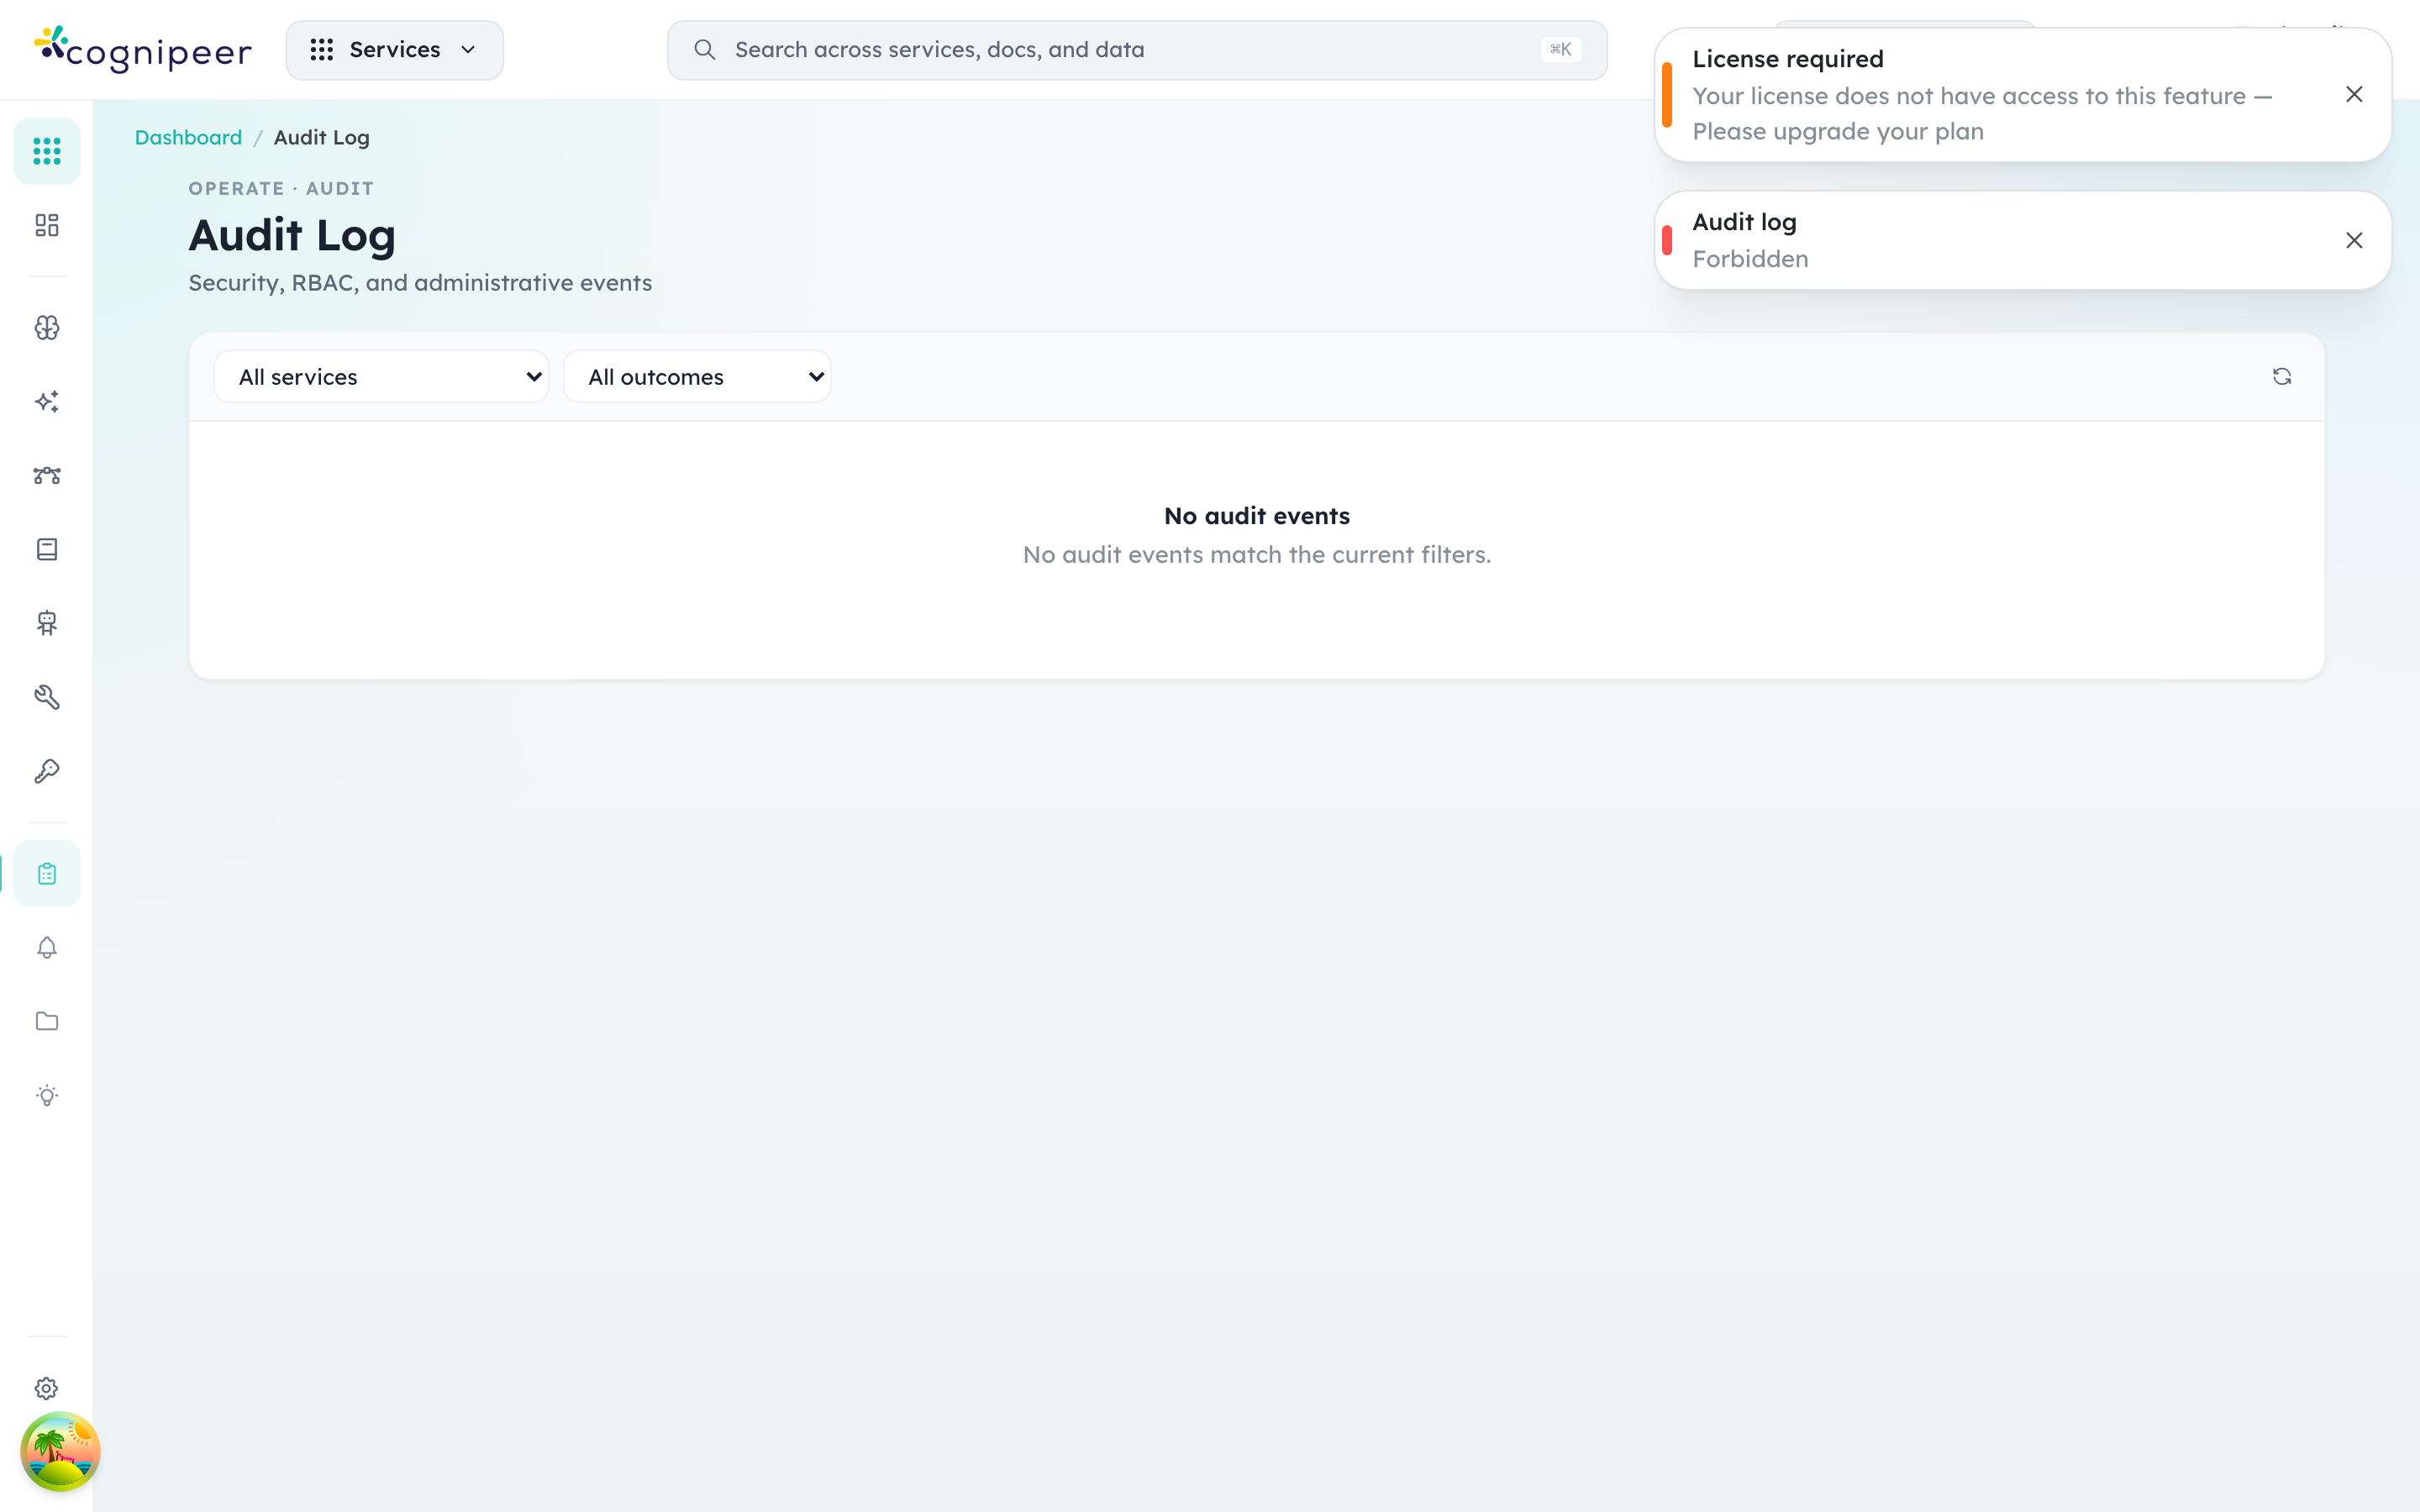
Columns surface the actor, the action, the resource type and ID, and the timestamp. Use the filters at the top to narrow by actor, action, or resource type when responding to a compliance question or investigating a configuration drift.
License
The License screen shows what the current installation is allowed to do — plan tier, configured project budget versus active projects, expiry, and the signed license key payload.
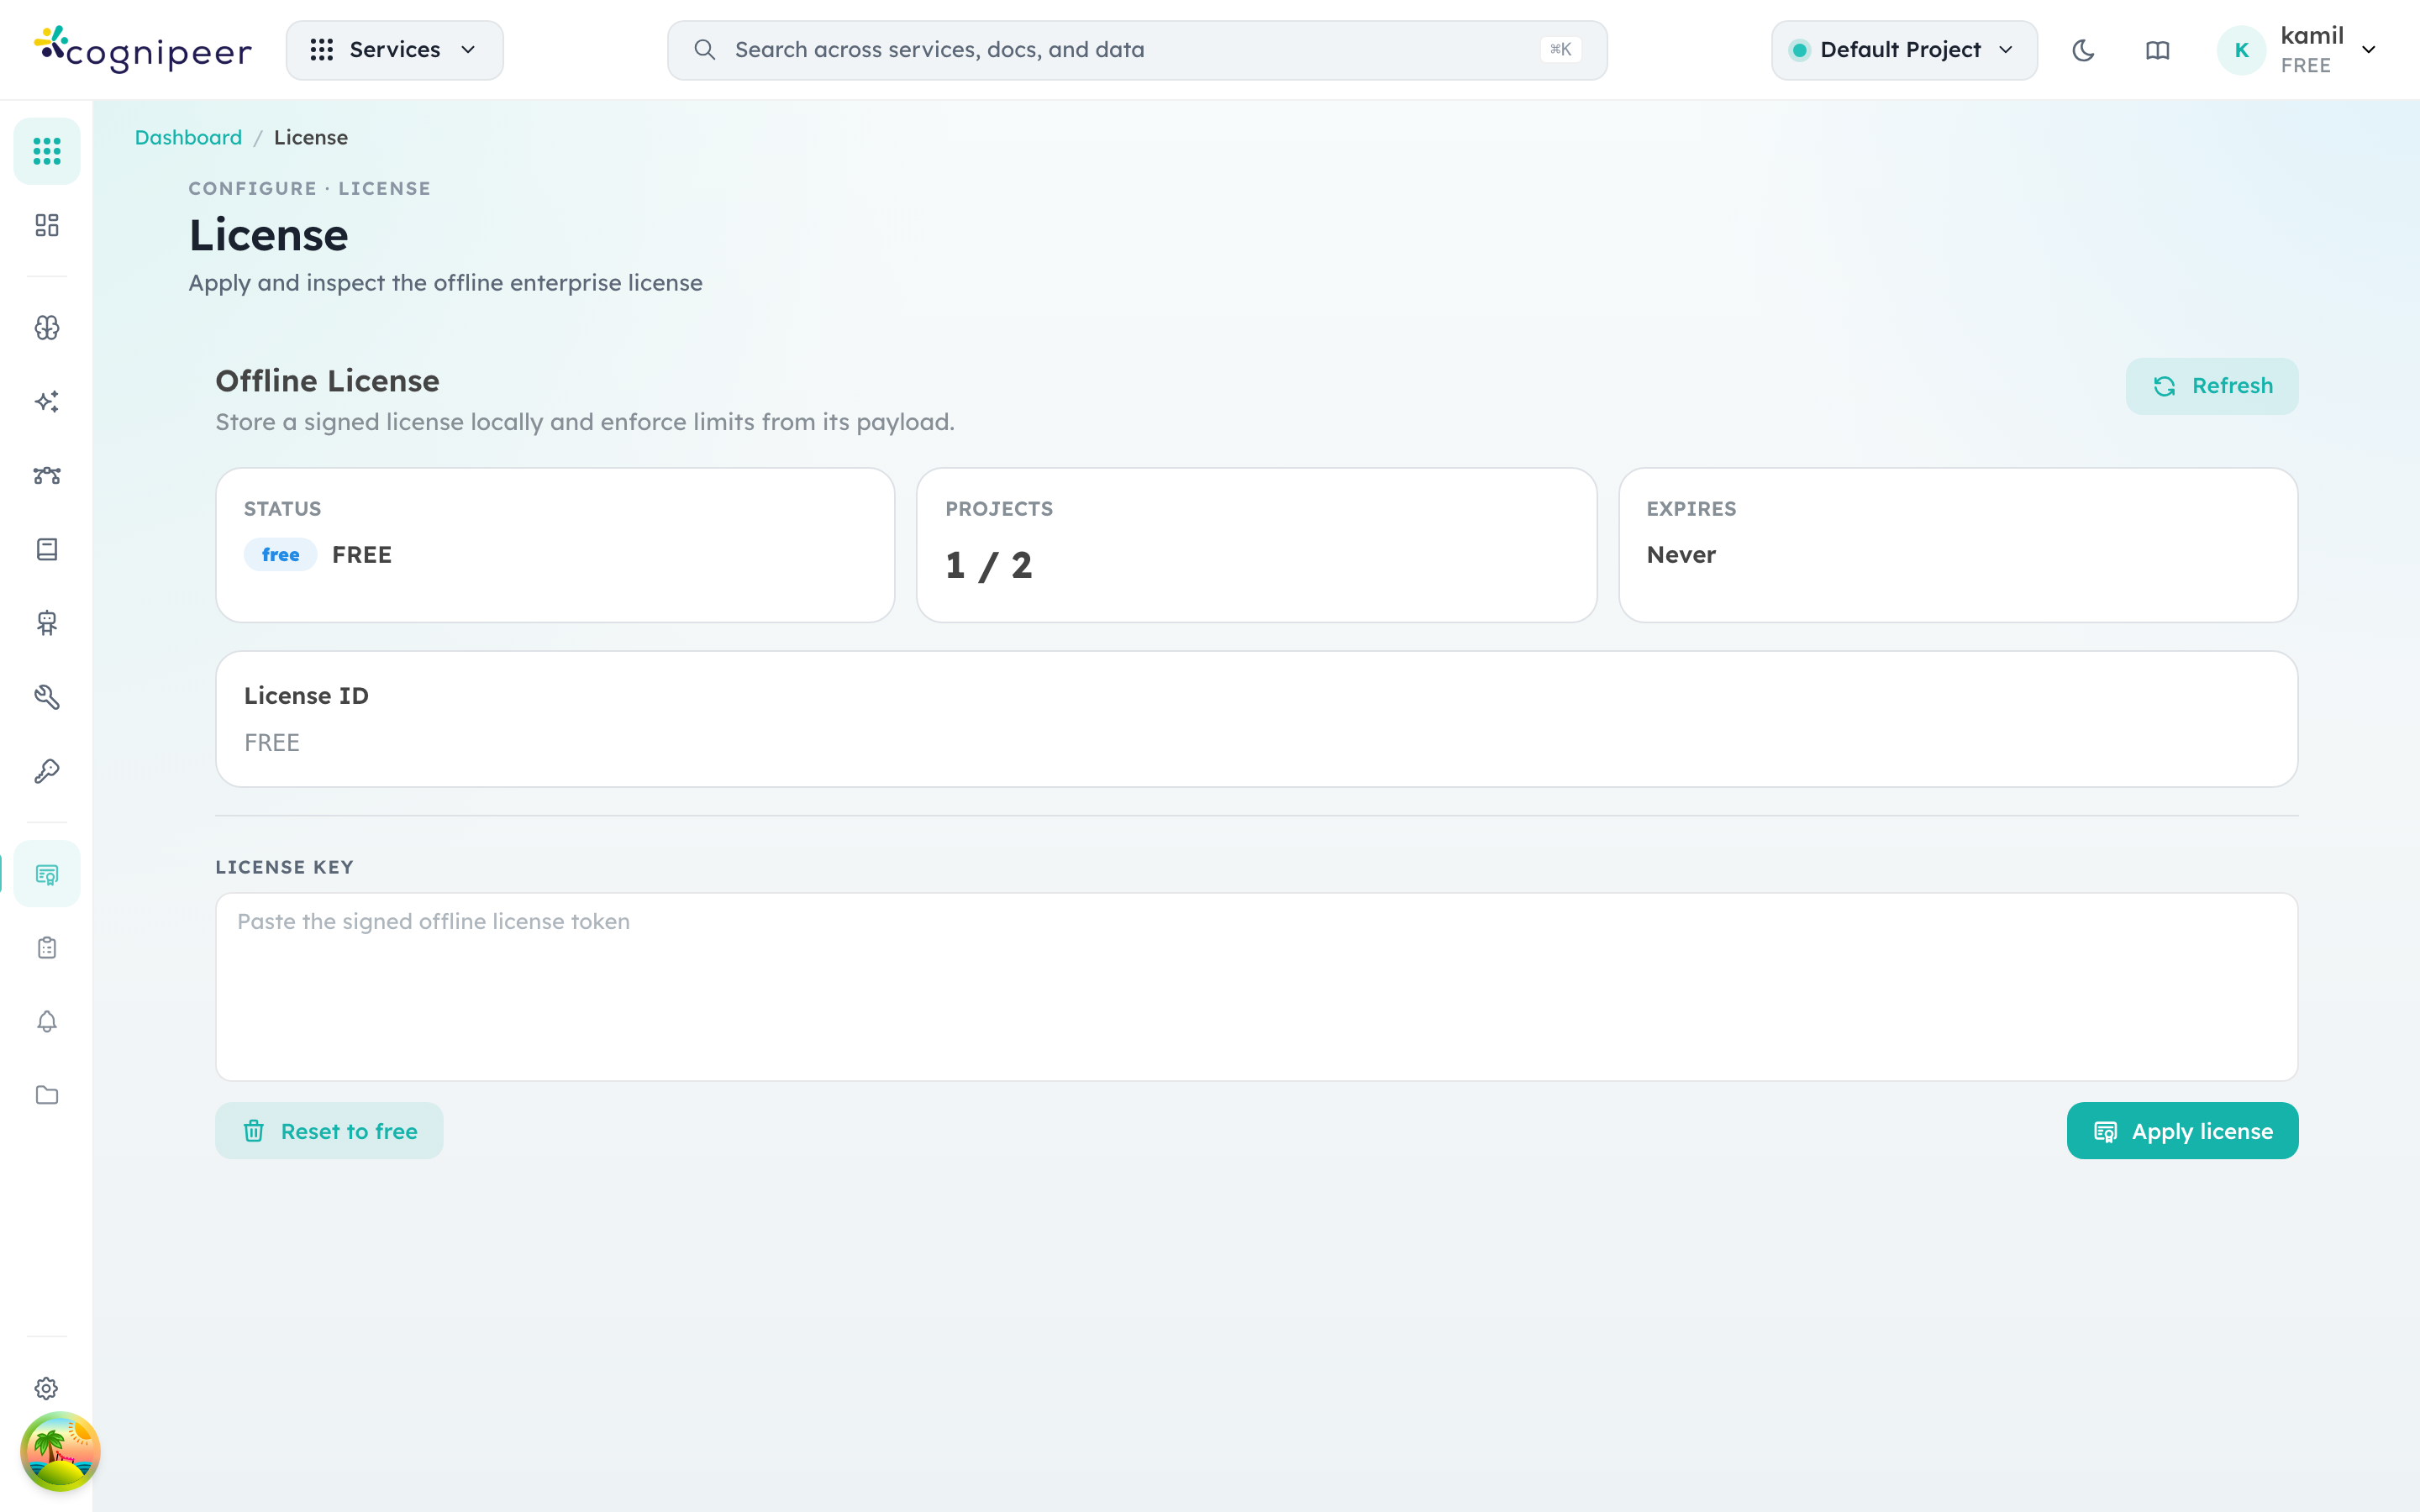
In an offline-enterprise deployment you paste the signed token here; the runtime verifies it on every startup against the bundled public key and enforces the limits described in Licensing. Reset to free drops back to the bundled FREE license — useful for evaluating, not for production.
Cluster topology
Multi-node deployments add a second observability surface: the node registry and the per-entity instance assignments. The Cluster page in Admin → Cluster shows every running process, the queue provider in use (in-process vs BullMQ), and which agents, MCP servers, browsers, JS runtimes, inference servers, alert rules, and automations are pinned to which node. The same data is available programmatically via GET /api/cluster/overview and GET /api/cluster/instances.
Structured Logging
All server-side code uses the Winston-based structured logger:
import { createLogger } from '@/lib/core/logger';
const logger = createLogger('my-service');
Log Format
JSON (production):
{
  "timestamp": "2025-01-15 10:30:45.123",
  "level": "info",
  "scope": "inference",
  "requestId": "a1b2c3d4-5678-90ab-cdef",
  "tenantId": "tenant_acme",
  "message": "Chat completion",
  "model": "gpt-4",
  "tokens": 150,
  "latencyMs": 450
}
Pretty (development):
2025-01-15 10:30:45.123 info [inference](a1b2c3d4){tenant_acme} Chat completion {"model":"gpt-4","tokens":150}Configuration
| Variable | Default | Description |
|---|---|---|
LOG_LEVEL | debug (dev) / info (prod) | error, warn, info, debug |
LOG_FORMAT | pretty (dev) / json (prod) | json or pretty |
LOG_REQUEST_BODY | false | Log request body (sanitized) |
LOG_RESPONSE_BODY | false | Log response body (sanitized) |
Log Aggregation
JSON logs are compatible with common aggregation tools:
- ELK Stack — Elasticsearch, Logstash, Kibana
- Datadog — Direct JSON log ingestion
- Grafana Loki — Label-based log aggregation
- CloudWatch — AWS native log ingestion
Per-request fields (requestId, tenantId, scope) enable filtering and correlation across services.
Health Checks
Endpoints
| Endpoint | Purpose | Response |
|---|---|---|
GET /api/health/live | Liveness (is process alive?) | Always 200 |
GET /api/health/ready | Readiness (are dependencies healthy?) | 200 or 503 |
Health Report
{
  "status": "ok",
  "uptime": 86400,
  "timestamp": "2025-01-15T10:30:00.000Z",
  "checks": {
    "mongodb": { "status": "ok", "latencyMs": 5 },
    "cache": { "status": "ok", "latencyMs": 2, "details": { "provider": "redis" } }
  }
}
Status Values
| Status | Meaning |
|---|---|
ok | Component is healthy |
degraded | Component is working but with issues |
down | Component is unavailable |
Request Tracing
Every request gets a unique requestId (UUID) that flows through the entire processing chain:
Client → Middleware (set x-request-id)
       → Route Handler
         → Service Layer
           → Provider Call
             → All log entries include requestId
Clients can provide their own request ID via the X-Request-Id header or request_id body field.
Circuit Breaker Monitoring
Circuit breaker states are available programmatically:
import { getAllCircuitStates } from '@/lib/core/resilience';

const states = getAllCircuitStates();
// Map<string, { state: 'closed'|'open'|'half-open', failures: number }>
Monitor for open circuits to identify unhealthy providers.
Usage Tracking
Every LLM inference request is logged with:
| Field | Description |
|---|---|
| Model key | Which model was used |
| Provider | Which provider handled the request |
| Token counts | Input, output, total, cached |
| Latency | End-to-end request time (ms) |
| Status | Success or error |
| Tool calls | Any tool/function calls made |
| Request ID | For correlation |
Usage data is written asynchronously via fireAndForget to avoid impacting response latency.
Runtime Pool Stats
import { runtimePool } from '@/lib/core/runtimePool';

const { size, keys } = runtimePool.stats();
// size: number of cached provider SDK instances
// keys: list of cache keys
Async Task Monitoring
import { pendingTaskCount } from '@/lib/core/asyncTask';

const count = pendingTaskCount();
// Number of fire-and-forget tasks still running
Alerts
The gateway includes an alerting system with configurable rules:
- Alert Rules — Define conditions (thresholds, patterns) that trigger alerts
- Alert Channels — Define notification targets (email, webhook, etc.)
- Alert Events — Historical record of triggered alerts
Recommended Monitoring Stack
| Component | Purpose |
|---|---|
| JSON Logs | Log aggregation + search |
| Health endpoints | Kubernetes probes + uptime monitoring |
| Usage tracking | Dashboard analytics + billing |
| Circuit breaker states | Provider health monitoring |
| Async task count | Background processing health |